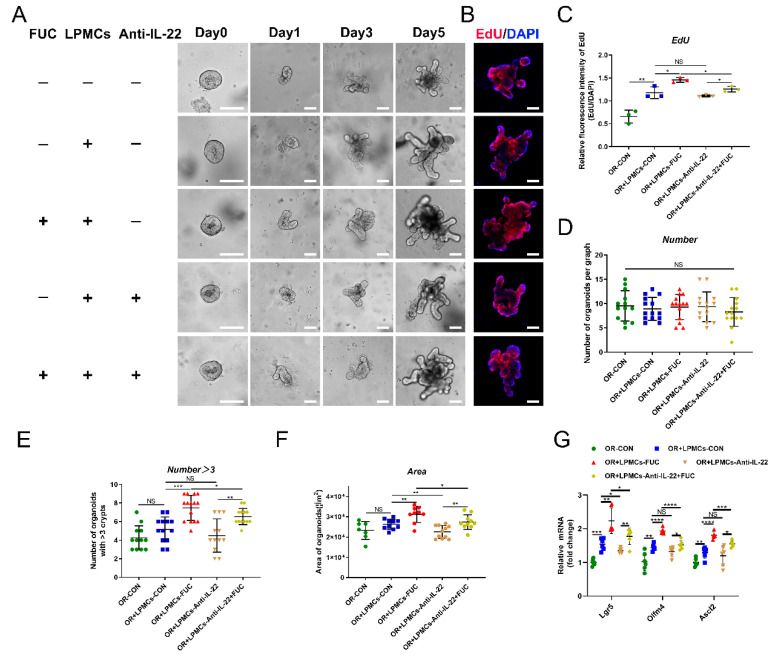
Figure 6.
Enhanced ISC proliferation via IL-22 from LPMCs after L-fucose treatment. (A) Representative images of LPMC and intestinal organoid coculture experiments (scale bar, 100 μm). (B) EdU staining of organoids (scale bar, 100 μm). (C) Quantitative analysis of EdU fluorescence intensity. (D) Number of organoids per field of view. (E) Number of organoids with more than 3 buds per graph. (F) Average area of organoids per graph. (G) qRT-PCR analysis of Lgr5, Olfm4 and Ascl2 in organoids. Data are expressed as the mean ± SD. * p < 0.05, ** p < 0.01, *** p < 0.001, **** p < 0.0001; NS, no significance. +, with. −, without.

