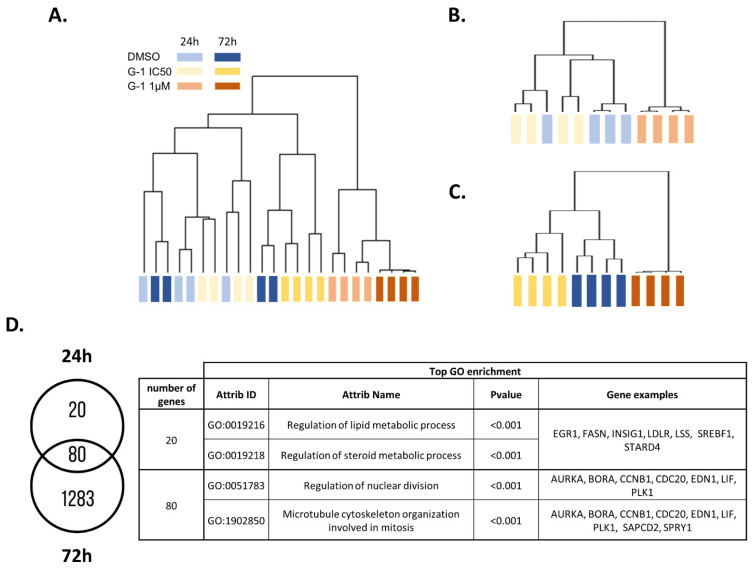
Figure 2.
Transcriptomic profile of U251 cells exposed to G-1 in a dose- and time-dependent manner. (A) Hierarchical clustering of U251 GBM cells depending on the gene transcription between DMSO 0.01% (vehicle), G-1 IC50 (644.8 nM), and G-1 1 µM at 24 h and 72 h of treatment. (B) Hierarchical clustering at 24 h and (C) 72 h after DMSO 0.01%, G-1 IC50, and G-1 1 µM exposure. (D) Venn diagram of the corresponding differentially expressed genes after G-1 exposure at 24 h and 72 h. The corresponding top GO enrichments and genes associated are summarized in the table.

