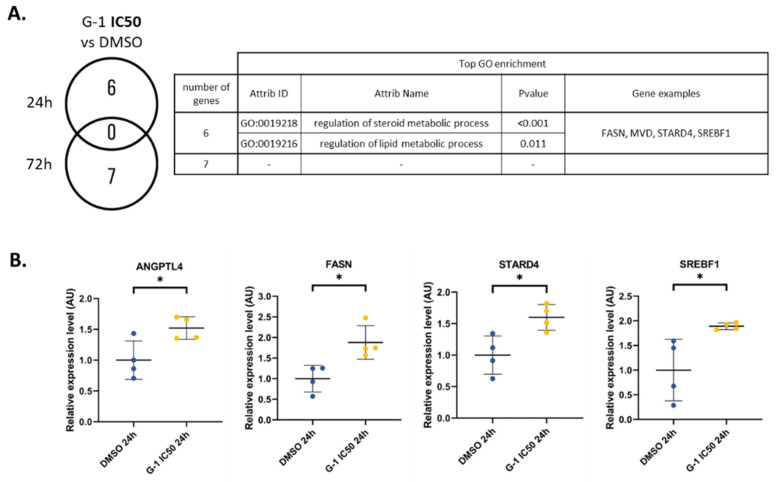
Figure 4.
Dual effect of G-1 altering lipid metabolism and nuclear division pathways. (A) Number of vehicle versus G-1 IC50 (644.8 nM) DEGs and table of associated functions at 24 h and 72 h. (B) RT-qPCR analysis of the FASN, STARD4, ANGPTL4, and SREBF1 expressions in the RADH87 primary GBM cell line after 24 h of G-1 IC50 (562.5 nM) exposure. Data are presented as the mean ± SD. Significance level was determined using t-tests, where * indicates p < 0.05; n = 4.

