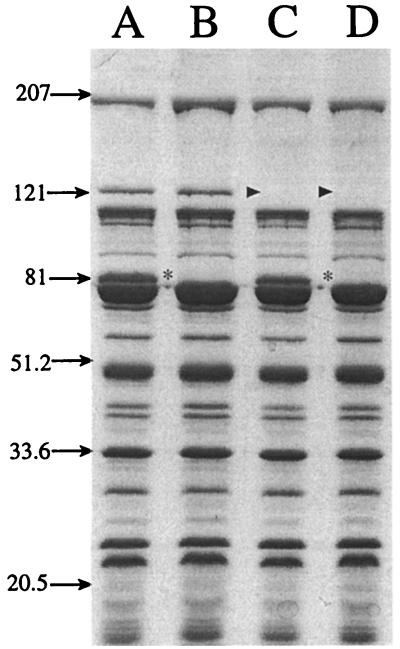
FIG. 2.
An SDS-PAGE gel, stained with Coomassie blue, showing the OMP profile of strain 7169 (lane A) and the isogenic mutants 7169b12 (lane B), 7169tbpA35 (lane C), and 7169tbpAB-1 (lane D) grown under iron-depleted conditions. Asterisks (lanes B and D) denote the loss of TbpB expression, and the lack of TbpA expression is indicated by arrowheads (lanes C and D). Molecular size standards are shown in kilodaltons.

