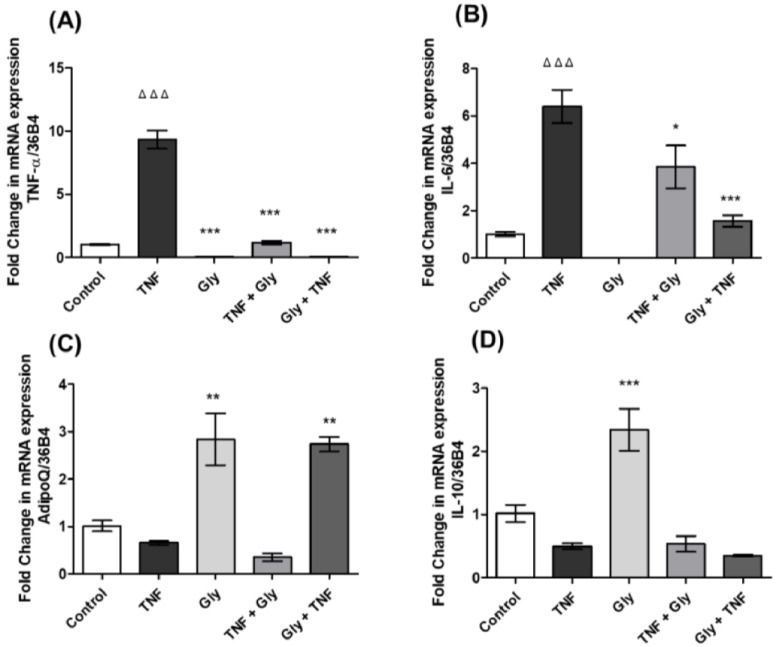
Figure 2.
Cytokine gene expression. Control = control group (without stimuli), TNF = TNF-α group (TNF- α stimulus), Gly = glycine group (glycine stimulus), TNF + Gly = TNF-α stimulus before glycine stimulus, Gly + TNF = glycine pre-treatment before TNF-α stimulus. (A) TNF-α gene expression; (B) IL-6 gene expression; (C) AdipoQ gene expression; and (D) IL-10 gene expression. The data are expressed as the mean ± standard error (n = 3). Normalised to 36B4 housekeeping gene. * Significant difference compared between the TNF group and the other groups. * p < 0.05, ** p < 0.01, *** p < 0.001. Δ Significant difference compared between stimuli and control group. ΔΔΔ p < 0.001.

