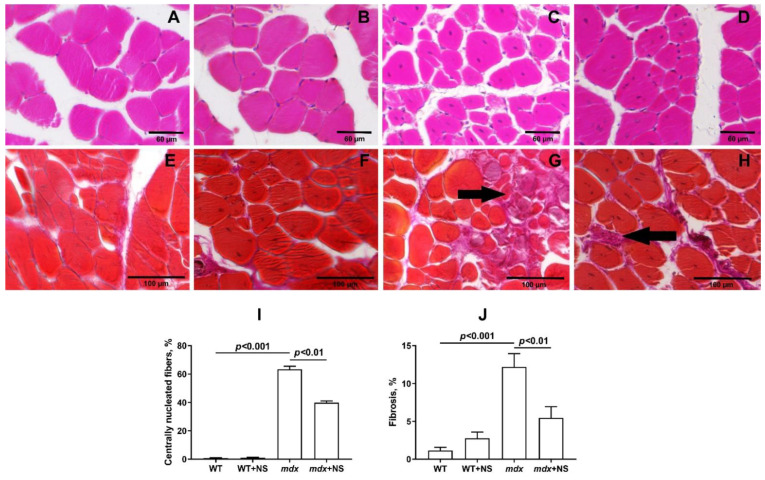
Figure 8.
Representative histology images of skeletal muscle tissue (quadriceps) showing myofibers containing centrally located nuclei (A–D) and fibrotic area ((E–H), black arrows) from the WT (A,E), WT + NS1619 (B,F), mdx (C,G) and mdx + NS1619 (D,H) groups of mice. The bars are equal to 60 (A–D) and 100 μm (E–H). Diagram (I,J) show the percentage of myofibers containing centrally located nuclei and the amount of interstitial fibrosis in the skeletal muscles of the experimental animals. The data are presented as m ± SEM. The level of fibrosis was evaluated as the percentage ratio of the hematoxylin van Gieson (HvG) staining areas (pink) that represented collagen and other connective tissue elements in the common area of the tissue, wherein at least 10 sections were analyzed for each sample. Quantitative data of the centrally nucleated fibers from H&E staining are from an average of 8–10 unique visual fields from each animal and expressed as a percentage of the total number of myofibers counted.

