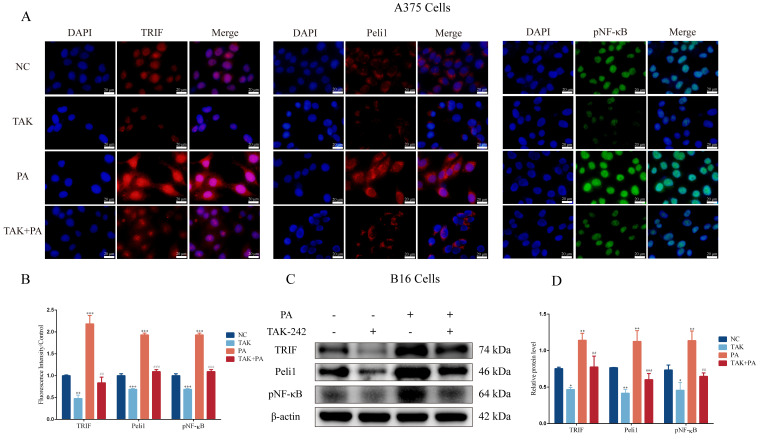
Figure 5.
The fluorescence intensity and protein expression of TLR4/TRIF-Peli1-pNF-κB pathway after TAK-242 treatment. (A) The fluorescence intensity of TRIF, Peli1, and pNF-κB in A375 cells. (B) Quantitative analysis of fluorescence intensity. (C) The blots of TRIF, Peli1, and pNF-κB in B16 cells. (D) Quantitative analysis of TRIF, Peli1, and pNF-κB expression in B16 cells. In A375 and B16 cells, treatment with PA or TAK-242 (+) and no treatment with PA or TAK-242 (-). * p < 0.05, ** p < 0.01, or *** p < 0.001 compared with the control group. ## p < 0.01 or ### p < 0.001 compared with the PA group; the significance of the ANOVA.

