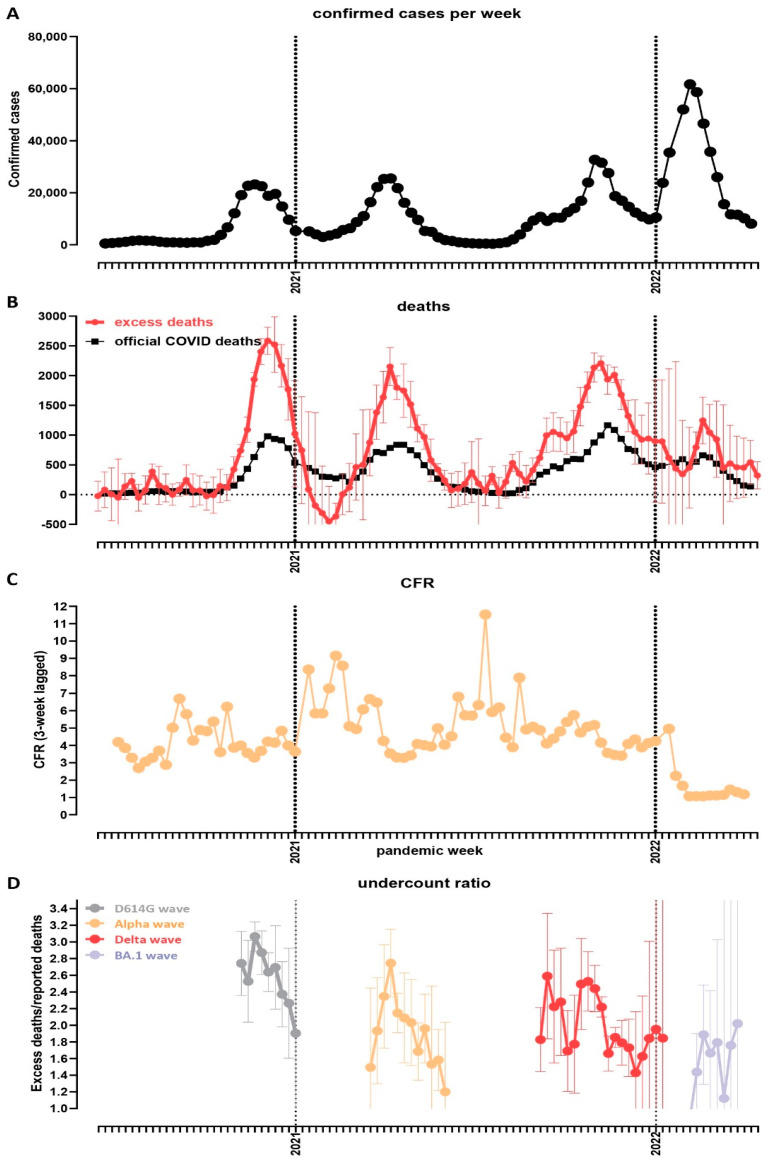
Figure 3.
Temporal trajectory of the COVID-19 pandemic in Bulgaria. (A) Confirmed cases over time (weekly); (B) officially reported and excess deaths over time (weekly); (C) CFR over time. Data on reported cases and deaths were obtained from the Our World In Data website [24]. (D) Evolution of the undercount ratio (excess mortality divided by official COVID-19 deaths) over time (note that the periods between waves, for which estimates of excess mortality are uncertain, are omitted from the graph).

