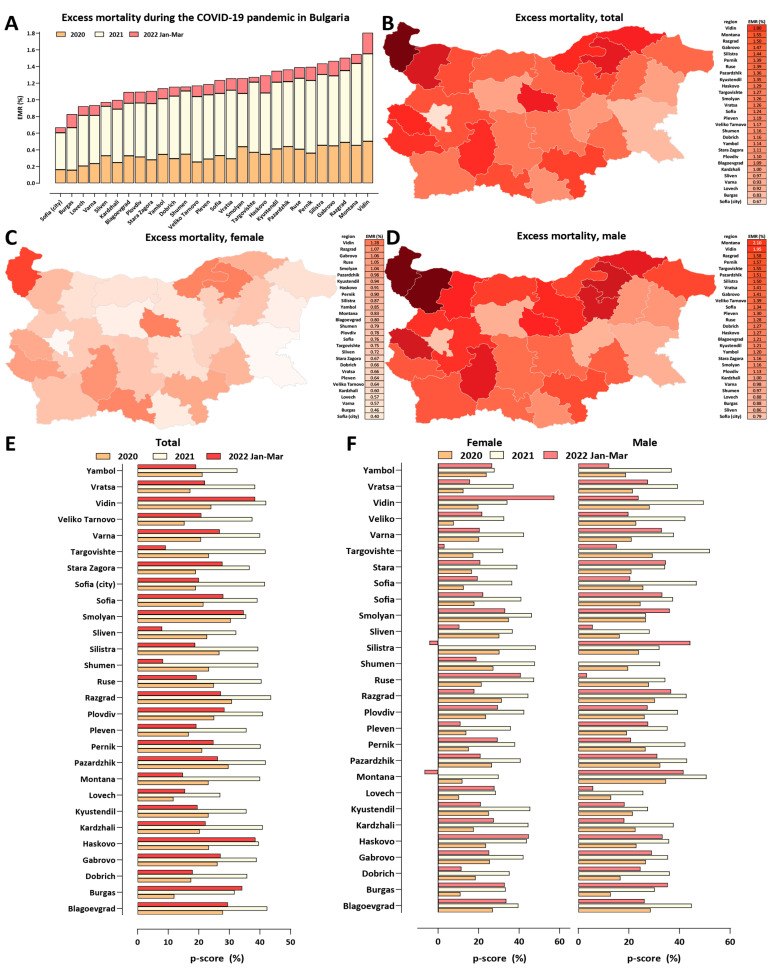
Figure 4.
Regional excess mortality patterns in Bulgaria during the COVID-19 pandemic (up to the end of March 2022). (A) Excess and official mortality by region and year; (B) excess mortality by region, in total; (C) excess mortality by region, for males; (D) Bulgaria, excess mortality by region, for females; (E) excess mortality (P-scores), per year; (F) excess mortality (P-scores), for males and females, per year.

