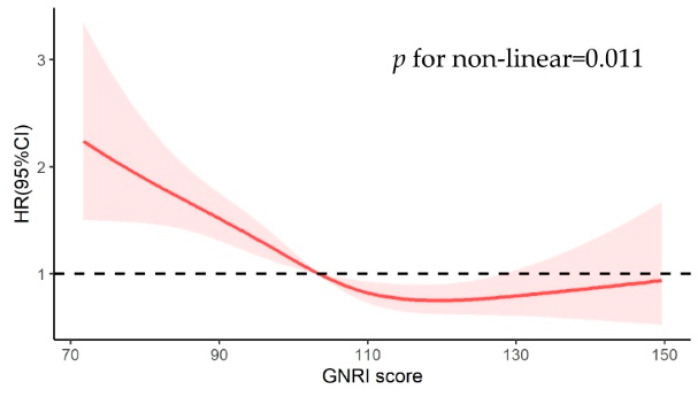
Figure 3.
Relationship between GNRI score as a continuous variable and 1-year mortality in the matched cohort. A thick red line indicates hazard ratio estimates, with reddish shaded areas showing 95% confidence intervals derived from the restricted cubic spline. The reference line is indicated by a solid bold line at a hazard ratio of 1.0.

