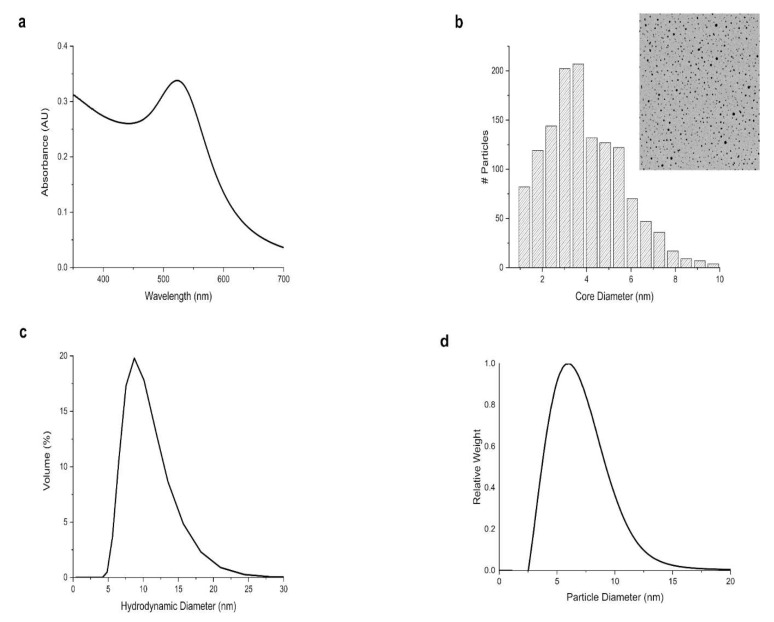
Figure 2.
Characterization of the size and dispersity of usGNPs. (a) UV-Vis spectrum (λ 350–700 nm) shows a surface plasmon band with a local maximum at ~520 nm. (b) TEM picture and core size distribution indicate a mean core size of 4 nm. (c) DLS hydrodynamic size distribution by volume and (d) DCS diameter distribution confirm monodispersity and that functionalized particles remain in the ultrasmall range.

