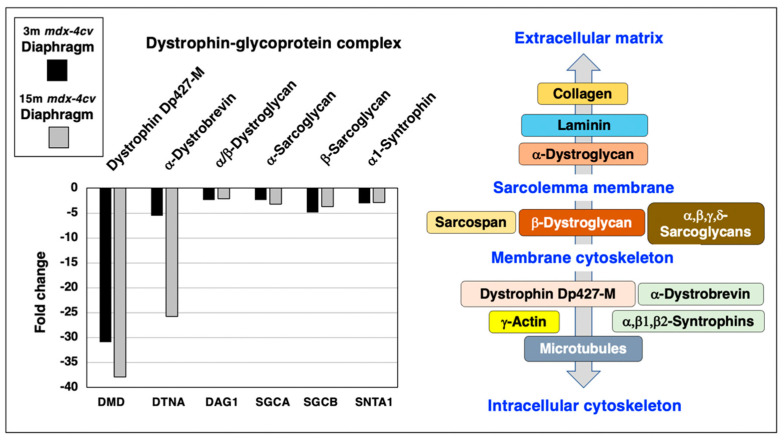
Figure 3.
Proteomic analysis of the expression of the dystrophin-glycoprotein complex in 3−month (3 m, black bars) versus 15−month (15 m; grey bars) old mdx-4cv diaphragm muscle. On the left is shown a bar diagram of the fold change in abundance of representative members of the dystrophin-glycoprotein complex, as determined by comparative proteomics. Identified proteins included Dystrophin (DMD), α/β-Dystroglycan (DAG1), α-Sarcoglycan (SGCA), β-Sarcoglycan (SGCB), α-Dystrobrevin (DTNA) and α1-Syntrophin (SNTA1). On the right side is shown a diagrammatic presentation of the dystrophin-glycoprotein complex [20].

