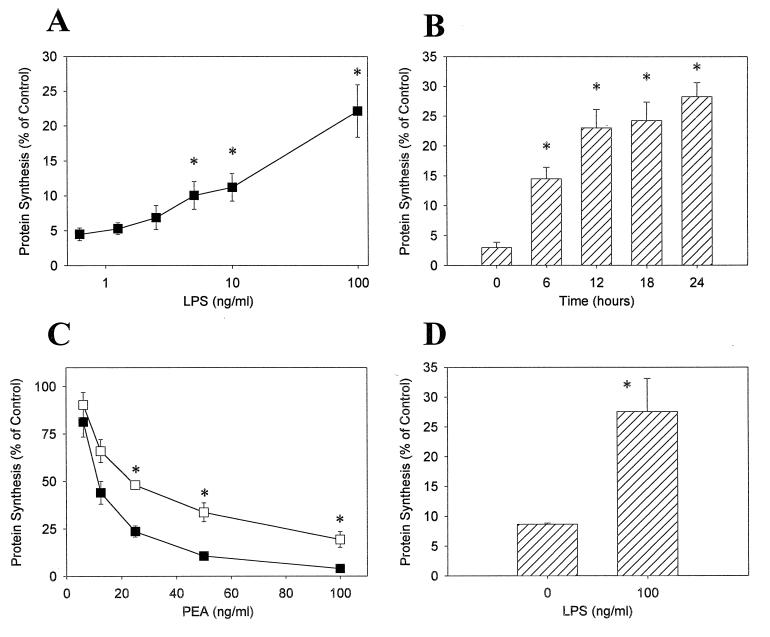
FIG. 2.
Altered HS-P PEA sensitivity following pretreatment with LPS. HS-P cells were treated for either 24 h with LPS at the indicated concentrations (A) or with 100 ng of LPS per ml for 6, 12, 18, or 24 h (B). Following LPS exposure, cells were challenged with 100 ng of PEA per ml for 2 h. (C) HS-P cells were pretreated with 100 ng of LPS per ml for 24 h (open squares) or were untreated (solid squares). Cells were then challenged with PEA for 2 h at the indicated concentrations. Following toxin exposure, cells were pulsed with media containing [3H]leucine for 21 h. (D) LPS-treated (100 ng/ml, 24 h) and nontreated cells were challenged with 1,000 ng of PEA per ml for 15 min, washed, and exposed to [3H]leucine for 12 h. Each data point represents the mean ± standard error of three separate experiments. ∗, significantly different from untreated cells (P < 0.05).

