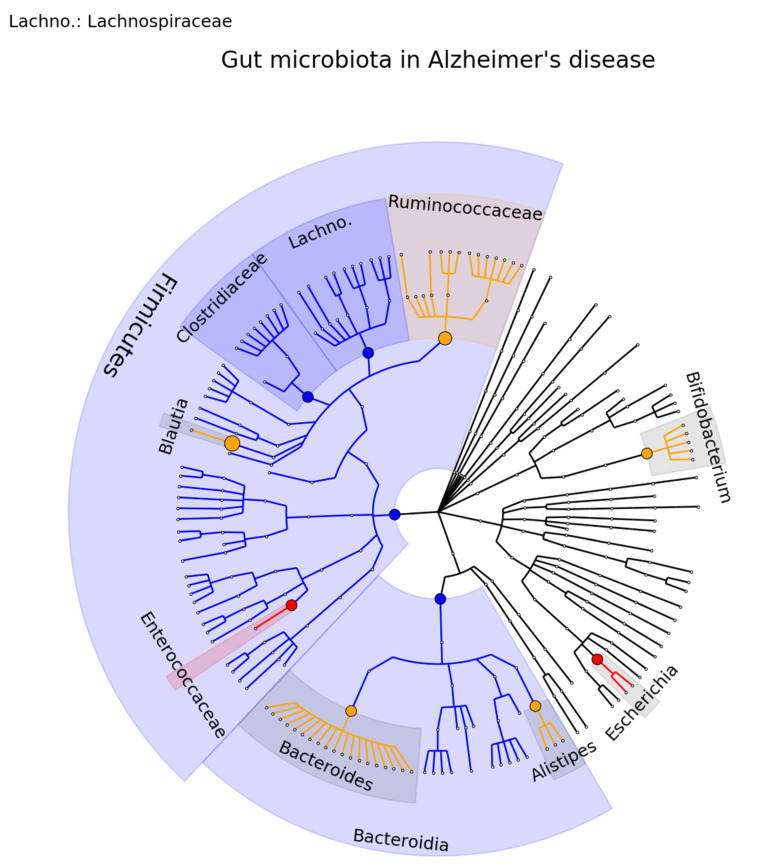
Figure 4.
Phylogenetic distributions of the microbiota involved in Alzheimer’s disease. Orange indicates inconsistent results, blue indicates a decrease in relative abundance, and red indicates an increase in relative abundance. These results are the summary of consistent findings of the included studies [71,72,73,74,75,76,77].

