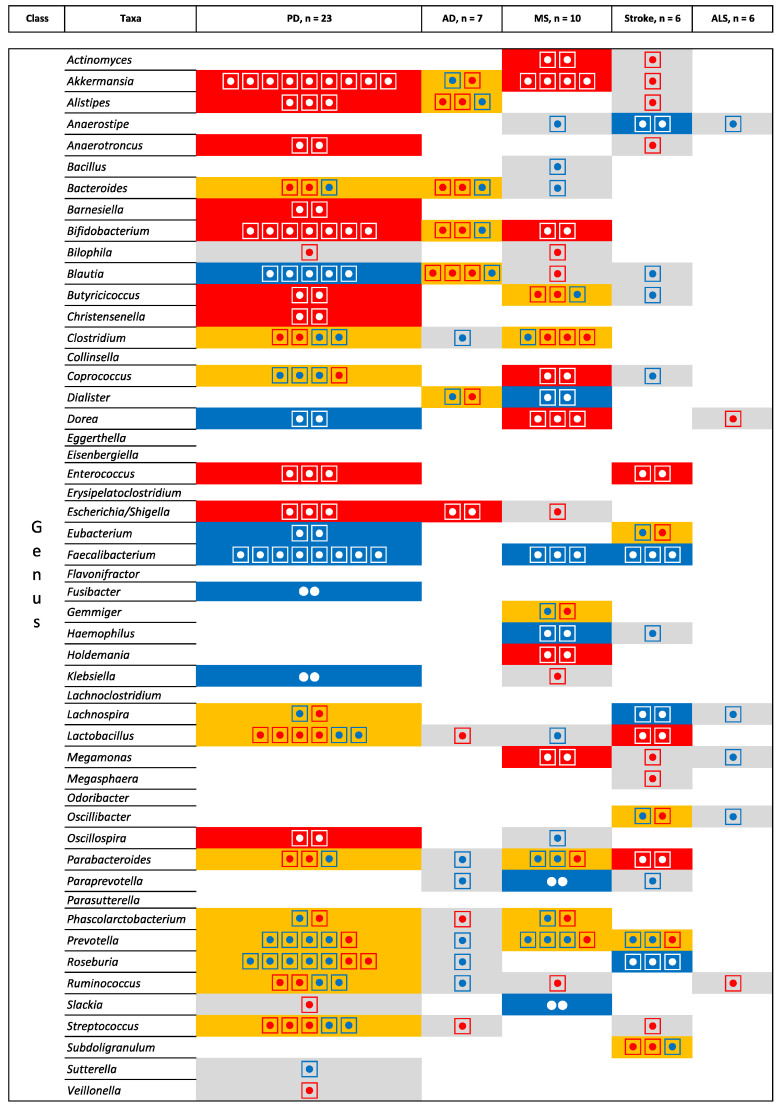
Figure 11.
Microbiota that have been identified in at least two studies for the same pathologies at the genus level. Grey is used for one study, orange indicates inconsistent results, blue indicates a decrease in relative abundance, and red indicates an increase in relative abundance. The numbers of the circle indicate the number of studies that identify the microbiota and the direction of the inconsistencies.

