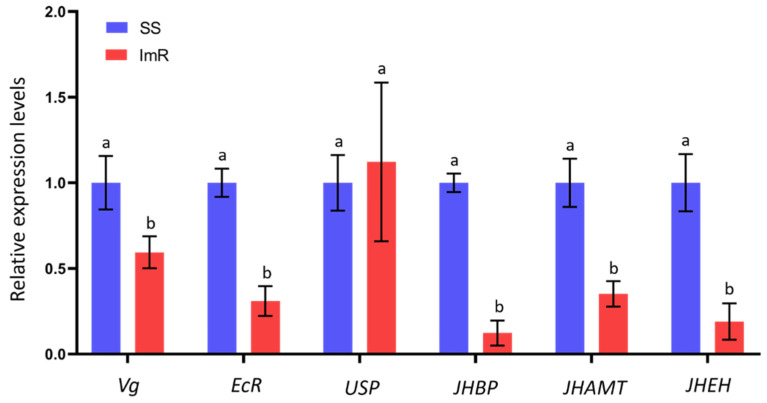
Figure 6.
Relative expression profiles of six genes related to the development and reproduction-related genes of imidacloprid susceptible (SS) and resistant strains (ImR) of Aphis gossypii analyzed by RT-qPCR. Expression level is presented as mean (±SE) of three independent experiments with control as the calibrator. Different letters above the bars indicate significant differences at the level of p < 0.05 (Student’s t-test). EF1α and β-Actin are used as internal control.

