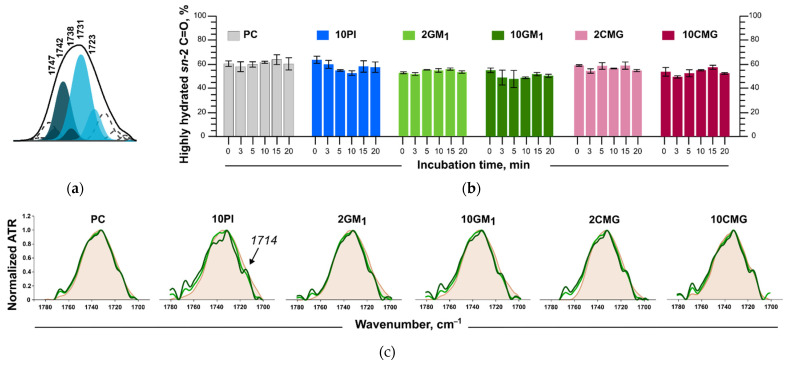
Figure 8.
(a) C=O deconvolution example; (b) changes in the percentage of sn-2 C=O hydrated groups during incubation with BSA; (c) C=O region in FTIR spectra for liposomes alone (beige) and with albumin (shades of green). FTIR spectra were recorded in PBS at 37 °C, lipid concentration of 12 mM, and albumin concentration of 6 mg/mL.

