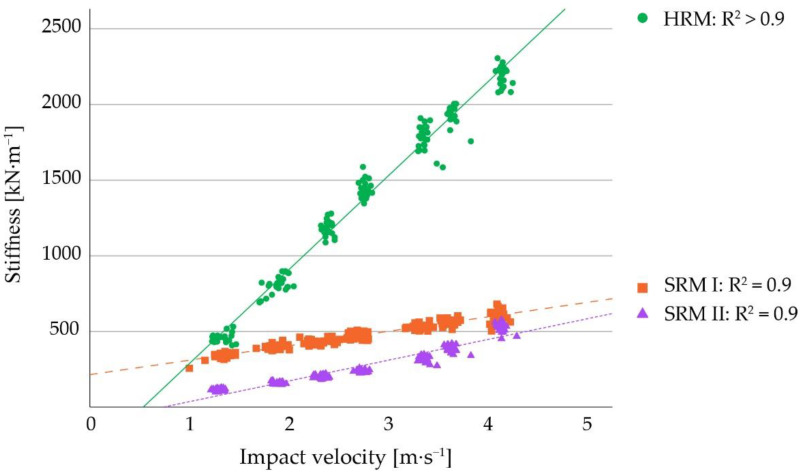
Figure 9.
Measured stiffness values, their respective regression lines, and coefficients of determination of different rubber mats. The rubber mats shown in this graph are the first soft rubber mat (SRM I), the second soft rubber mat (SRM II), and the hard rubber mat (HRM). Note, that the stiffness scale here is 100 times greater than in Figure 8.

