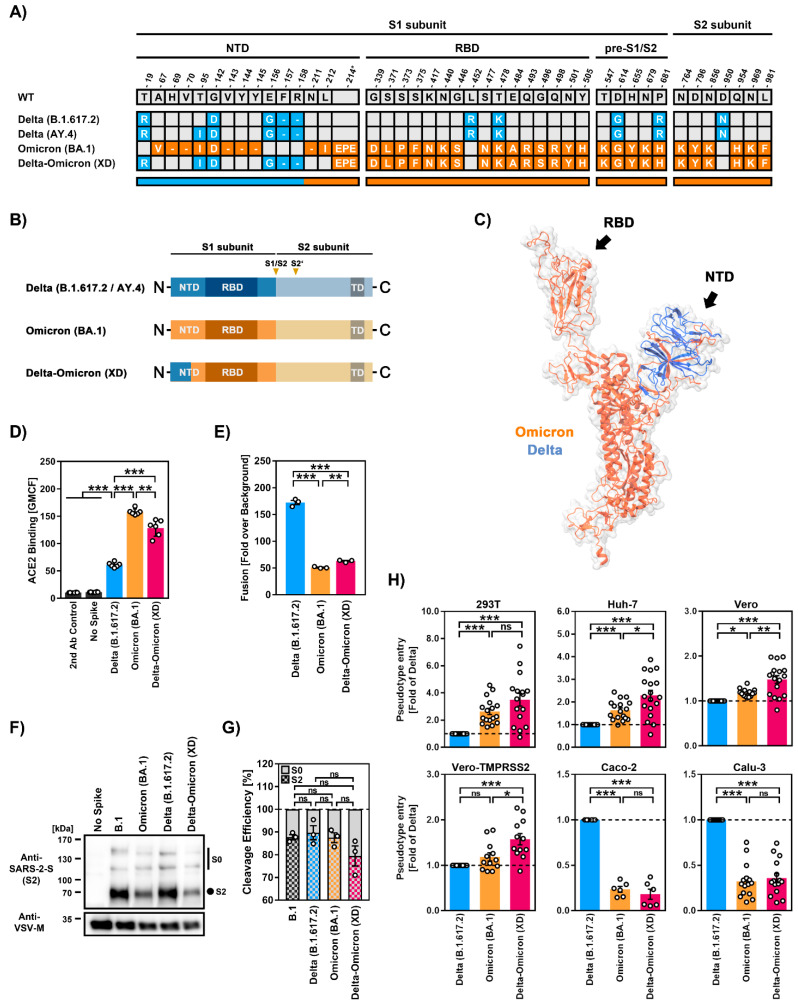
Figure 1.
Host cell tropism, ACE2 binding, cell–cell fusion, and cleavage efficiency by SARS-CoV-2 Delta-Omicron (XD) recombinant lineage. (A) Summary of mutations present in the different SARS-CoV-2 S proteins (numbering according to the S protein of SARS-CoV-2 Wuhan-Hu-01). S protein mutations found in variants B.1.617.2, AY.4 (both Delta, blue), BA.1 (Omicron, orange), and XD (Delta-Omicron, blue and orange) are highlighted. Abbreviations: NTD = N-terminal domain; RBD = receptor-binding domain. (B) S protein domain structure. Abbreviations: TD = transmembrane domain; S1/S2 and S2′ = cleavage sites in the S protein. (C) Three-dimensional structure of monomeric XD S protein in which the regions originating from either the Delta (blue) or Omicron (orange) S protein are highlighted. (D) Soluble ACE2 binding by the indicated S proteins was analyzed by flow cytometry. Cells incubated with secondary antibody alone served as controls. Data represent mean ± SD geometric mean channel fluorescence from six biological replicates. Statistical analysis was performed using two-tailed Student’s t-test (**, p ≤ 0.01; ***, p ≤ 0.001). (E) S protein-driven cell–cell fusion was analyzed using a beta-galactosidase reconstitution assay. Data represent mean ± SEM cell–cell fusion (normalized against the assay background, no S protein) from three biological replicates, each carried out with four technical replicates. Statistical analysis was performed using two-tailed Student’s t-test (**, p ≤ 0.01; ***, p ≤ 0.001). (F) S protein particle incorporation and cleavage efficiency were analyzed by immunoblot. Data represent a single biological replicate and results were confirmed in two additional experiments. (G) Quantification of S protein cleavage. Data represent mean ± SEM cleavage efficiency (normalized against total S protein) from three biological replicates. Statistical analysis was performed using two-tailed Student’s t-test (not significant [ns], p > 0.05). Abbreviations: S0, uncleaved S protein; S2, S2 subunit of cleaved S protein. (H) S protein-driven cell entry was analyzed by transduction of the indicated target cell lines using pseudotype particles bearing the respective S proteins. Data represent mean ± SEM cell entry efficiency (normalized for Delta) from six to twelve biological replicates (each with four technical replicates). Statistical analysis was performed using two-tailed Student’s t-test (ns, p > 0.05; *, p ≤ 0.05; **, p ≤ 0.01; ***, p ≤ 0.001). Please also see Figure S2 for representative unprocessed pseudotype entry data.

