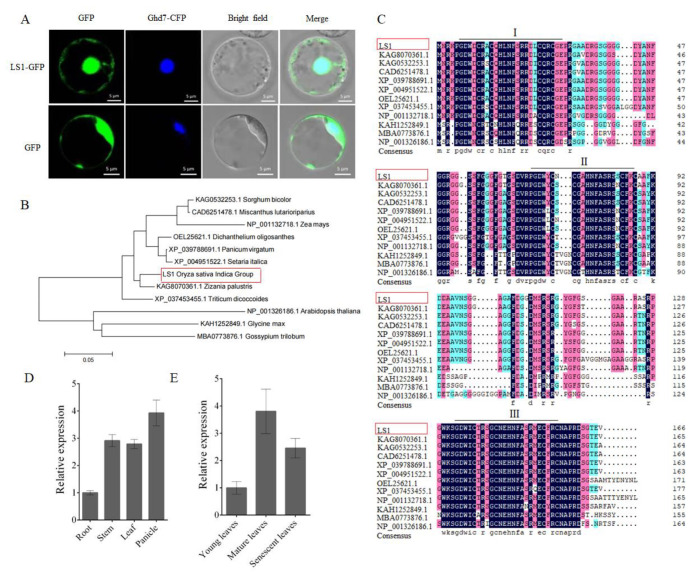
Figure 1.
Expression assay and bioinformatic analysis of leaf senescence 1 (LS1). (A) Subcellular localization of LS1. LS1 fused with green fluorescence protein (GFP) was transiently expressed in rice protoplasts. The bottom panels show the localization of GFP as the control. Scale bar = 5 μm. (B) Phylogenetic tree analysis of the LS1 and its homologies. Each accession number represents a gene; their information is available in NCBI. (C) Multiple sequence alignment analysis of LS1 and its homologies. (D) Expression pattern of LS1 in various tissues. (E) Expression pattern of LS1 in the leaves at various developmental stages. The error bars indicate SDs of three biological replicates (D,E).

