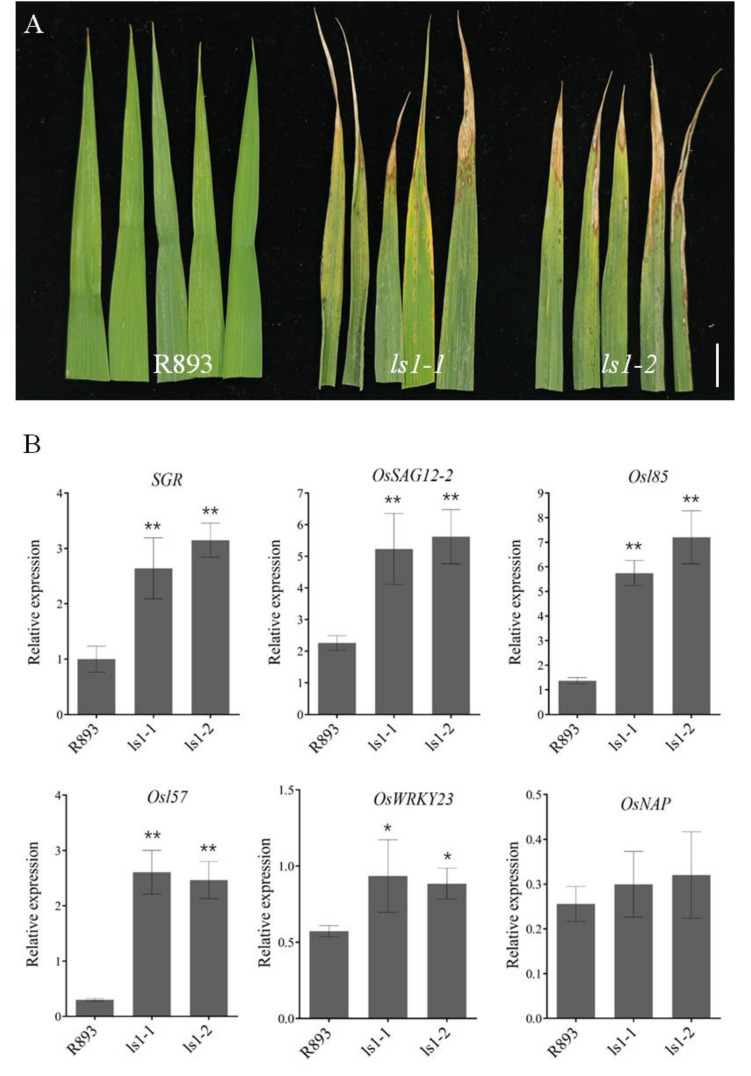
Figure 3.
Leaf upper phenotype in ls1 plants at the heading stage and expression levels of SAGs. (A) Leaf phenotype of WT and ls1 mutants at the heading stage. (B) Transcript levels of six SAGs were analyzed using RT-qPCR. The error bars indicate SDs of three biological replicates. The p-value was calculated using a Student’s t-test. ** p < 0.01, * 0.01 < p < 0.05. Bar = 2 cm (A).

