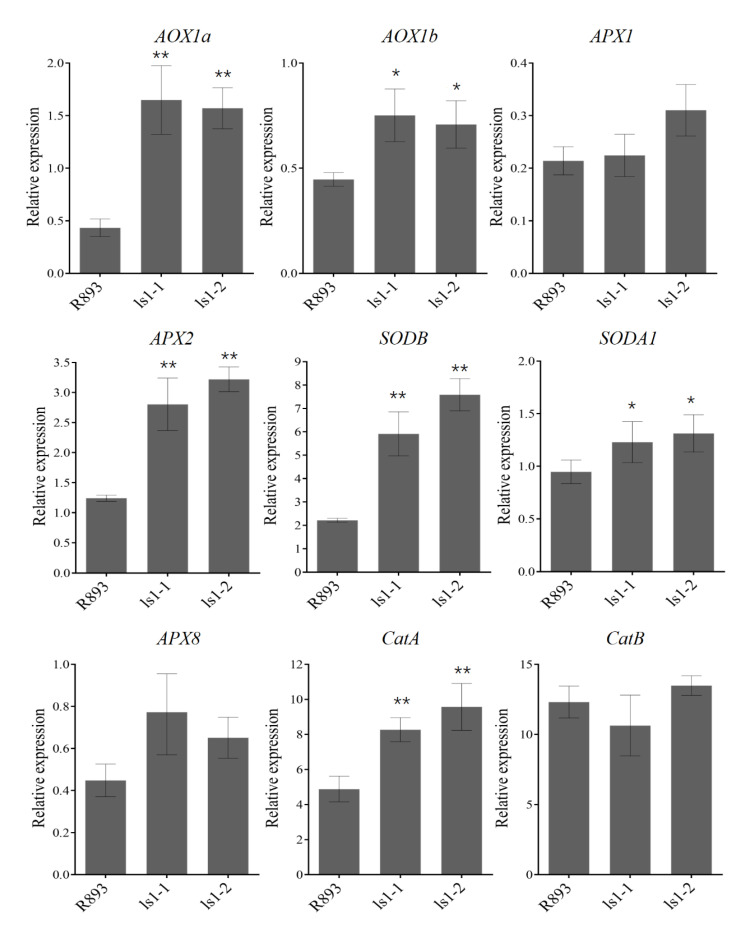
Figure 6.
Expression levels of senescence-related genes in WT and ls1 plants. Transcript levels of several ROS-associated marker genes were analyzed using RT-qPCR. Total RNA was obtained from the leaves of WT and ls1 plants at the heading stage. The error bars indicate SDs of three biological replicates. The p-value was calculated using a Student’s t-test. ** p < 0.01, * 0.01 < p < 0.05.

