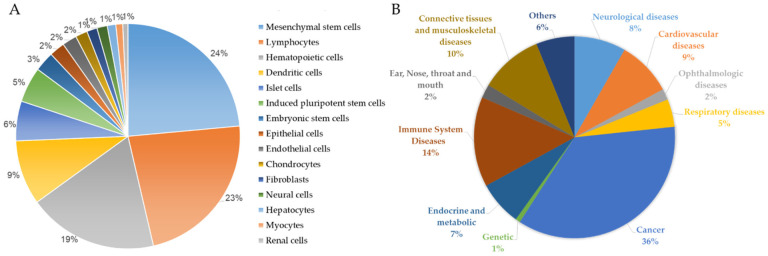
Figure 1.
Frequency distribution of recruiting, completed, and enrolling cell-based clinical trials in the past decade. (A) Pie chart showing the relative frequency distribution of clinical trials using indicated cell type. (B) Pie chart showing the relative frequency distribution of clinical trials for indicated diseases (from URL https://clinicaltrials.gov/, accessed on 16 August 2022).

