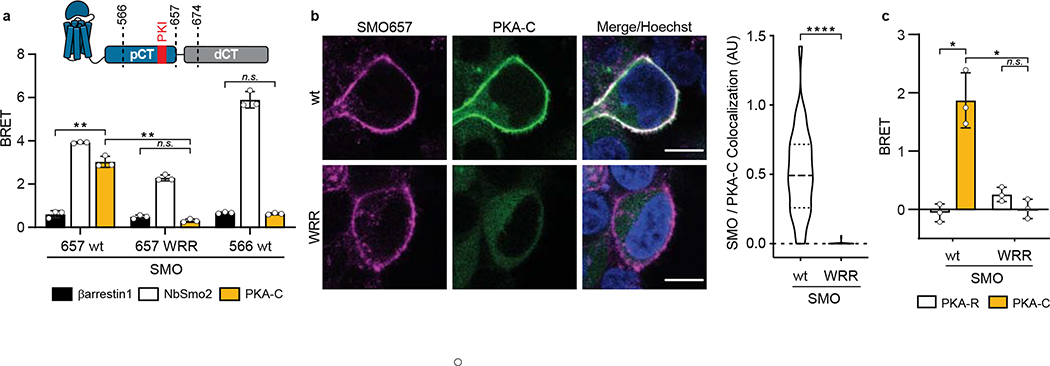
Fig. 4: The SMO PKI motif is required for Hh signal transduction.
a, Top, schematic diagram of truncated SMO expression constructs. Bottom, BRET analysis of SMO / PKA-C interactions in HEK293 cells expressing nanoluc-tagged wild-type SMO657 (SMO657 wt) or SMO657 harboring the WRR mutation (SMO657 WRR), along with YFP-tagged PKA-Cɑ. SMO566 (which lacks the C-tail) serves as a negative control donor. YFP-tagged βarrestin1 (which exhibits minimal binding to SMO) and NbSmo2 (which binds the intracellular surface of the SMO 7TM domain) serve as negative and positive control acceptors, respectively29. Data represent mean +/− standard deviation, n = three biologically independent samples. b, Left, confocal images of live HEK293 cells coexpressing GFP-tagged PKA-Cɑ with FLAG-tagged wild-type or mutant SMO674. Cells were treated with SMO agonist (SAG21k). Scale bar = 10 μm. Right, quantification of SMO / PKA-C colocalization with the median represented by a dashed line and the upper and lower quartiles indicated by dotted lines (n=34 or 48 cells for “wt” or “WRR”, respectively, examined over two independent experiments). c, BRET analysis of SMO / PKA-C interactions in IMCD3 cells expressing nanoluc-tagged wild-type or mutant SMO, along with low levels of PKA-Cɑ-YFP. PKA-RIɑ-YFP serves as a negative control. Under these conditions, PKA-Cɑ-YFP is expressed at substantially lower levels than PKA-RIɑ-YFP29. Data represent mean +/− standard deviation, n = three biologically independent samples. P < 0.05 (*); P < 0.01 (**), P < 0.0001 (****), n.s. = not significant. See Supplementary Table 1 for full statistical analysis.

