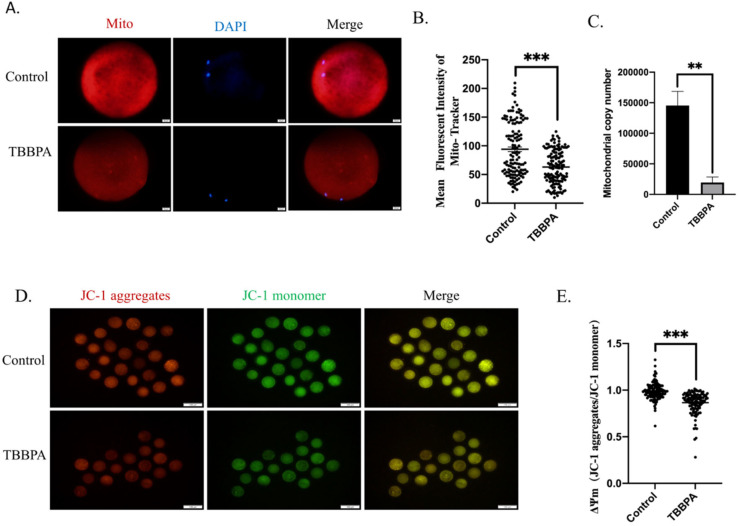
Figure 4.
Effects of TBBPA on mitochondrial function in oocytes: (A) Representative images of mitochondria in each group. Ex/Em, 529/590. Scale bar = 20 μm. (B) Mean fluorescent intensity of Mito-Tracker. Control, n = 134; TBBPA, n = 138. (C) mtDNA copy number was measured. (D) Mitochondrial membrane potential after TBBPA treatment. Ex/Em,: 488/530 nm; Ex/Em, 529/590. Scale bar = 20 μm. (E) ΔΨm after TBBPA treatment (JC-1 aggregates/ JC-1 monomer). Control, n = 124; TBBPA, n = 116. ** p < 0.01, *** p < 0.001.

