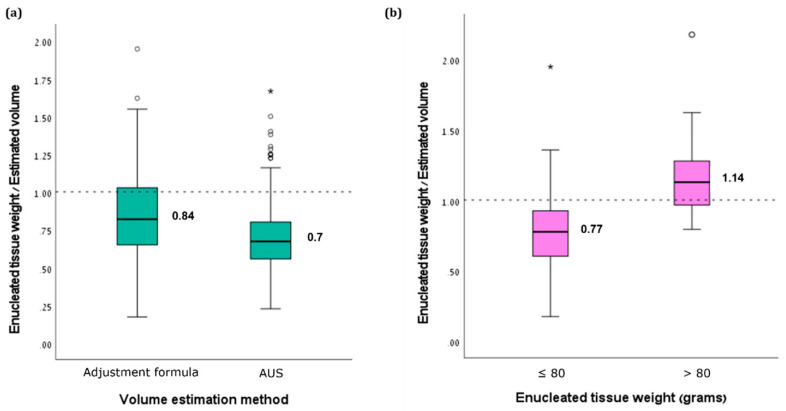
Figure 1.
Box-and-whisker plot showing the ratios of enucleated tissue weights and estimated volumes by (a) AUS and adjustment formula and by (b) adjustment formula among patients with tissue weights above and below 80 g. The dashed horizontal line at level 1.0 represents 100% accuracy. * Represents outliners.

