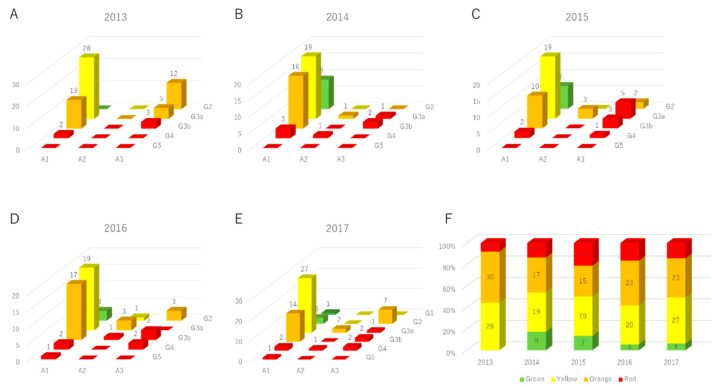
Figure 4.
Transition of CKD heat map. (A) The distribution of CKD heatmaps of subjects in 2013. (B) The distribution of CKD heatmaps of subjects in 2014. (C) The distribution of CKD heatmaps of subjects in 2015. (D) The distribution of CKD heatmaps of subjects in 2016. (E) The distribution of CKD heatmaps of subjects in 2017. (F) The changes in the proportion of heat maps for each year.

