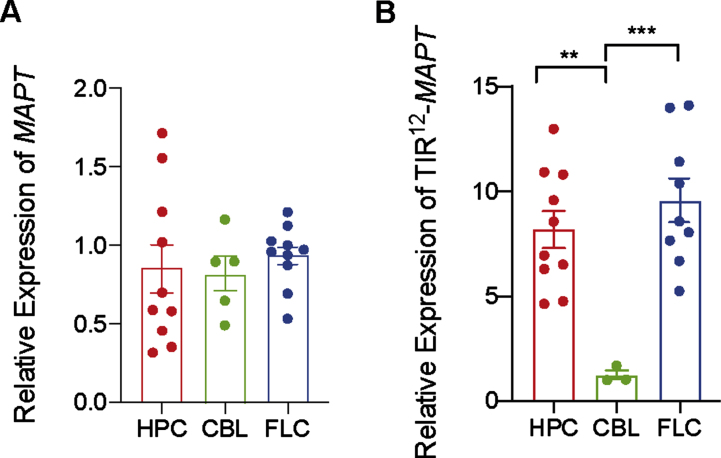
Fig. 3.
Differences in expression mRNA of total MAPT and TIR12-MAPT in hippocampus, cerebellum, and frontal lateral cortex. A) Relative expression of total MAPT in human control samples in hippocampus (HPC), cerebellum (CBL), and frontal lateral cortex (FLC) (B) and relative expression of TIR12-MAPT at the same samples. The graphs show the mean value±SEM (n = 3–10). **p = 0.004; ***p = 0.0008) using one-way ANOVA.

