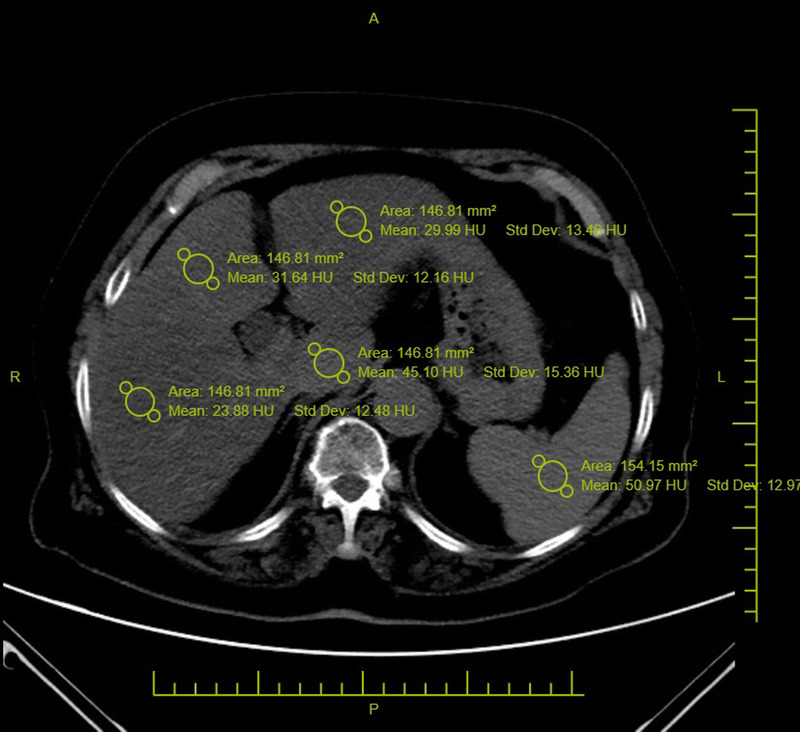
FIGURE 1.

Hepatic density values were measured by placing ROIs greater than 100 mm2 in size on all liver segments. These values were then averaged (L). Splenic density values were obtained by placing an ROI greater than 100 mm2 in size (S). The liver-to-spleen ratio was calculated as L/S. Figure 1 can be viewed online in color at www.jcat.org.
