FIGURE 2.

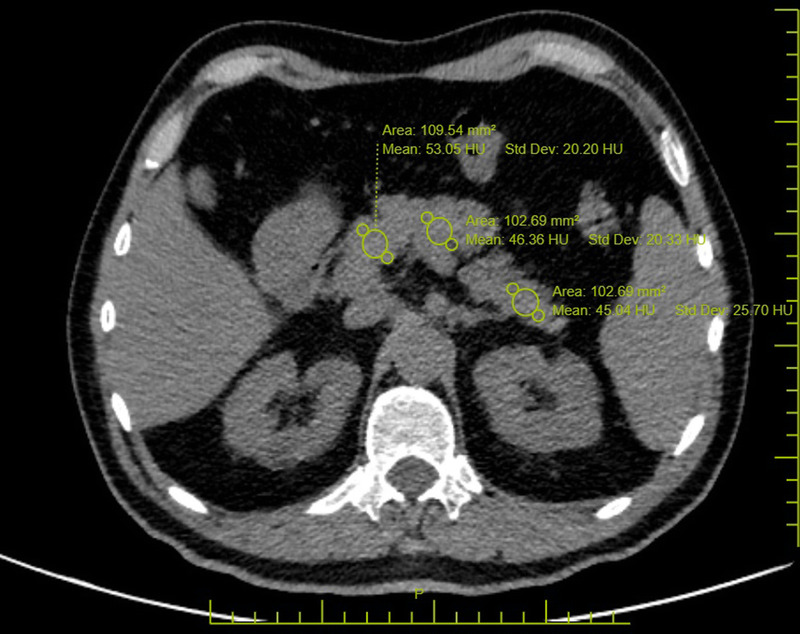
Pancreatic attenuation values were obtained by placing an average of 50 mm2 ROIs on the pancreatic head, corpus, and tail. These values were then averaged. Figure 2 can be viewed online in color at www.jcat.org.

Pancreatic attenuation values were obtained by placing an average of 50 mm2 ROIs on the pancreatic head, corpus, and tail. These values were then averaged. Figure 2 can be viewed online in color at www.jcat.org.