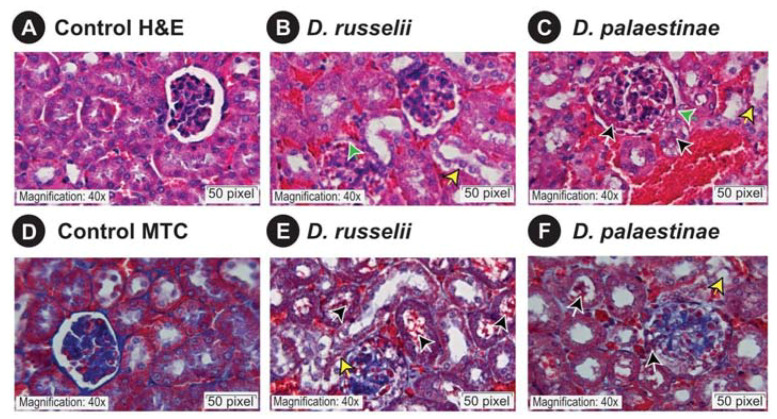
Figure 5.
Microscopic observations of mouse kidney sections. This figure shows hematoxylin-eosin and Masson’s trichrome stained kidney sections of the control mice (A,D), and D. russelii (B,E) and (D). palaestinae (C,F) venom-injected mice. A scale bar of 20 μm is shown, along with green, yellow and black arrows that indicate glomerular capsular space shrinkage, tubular injury and cellular debris, respectively.

