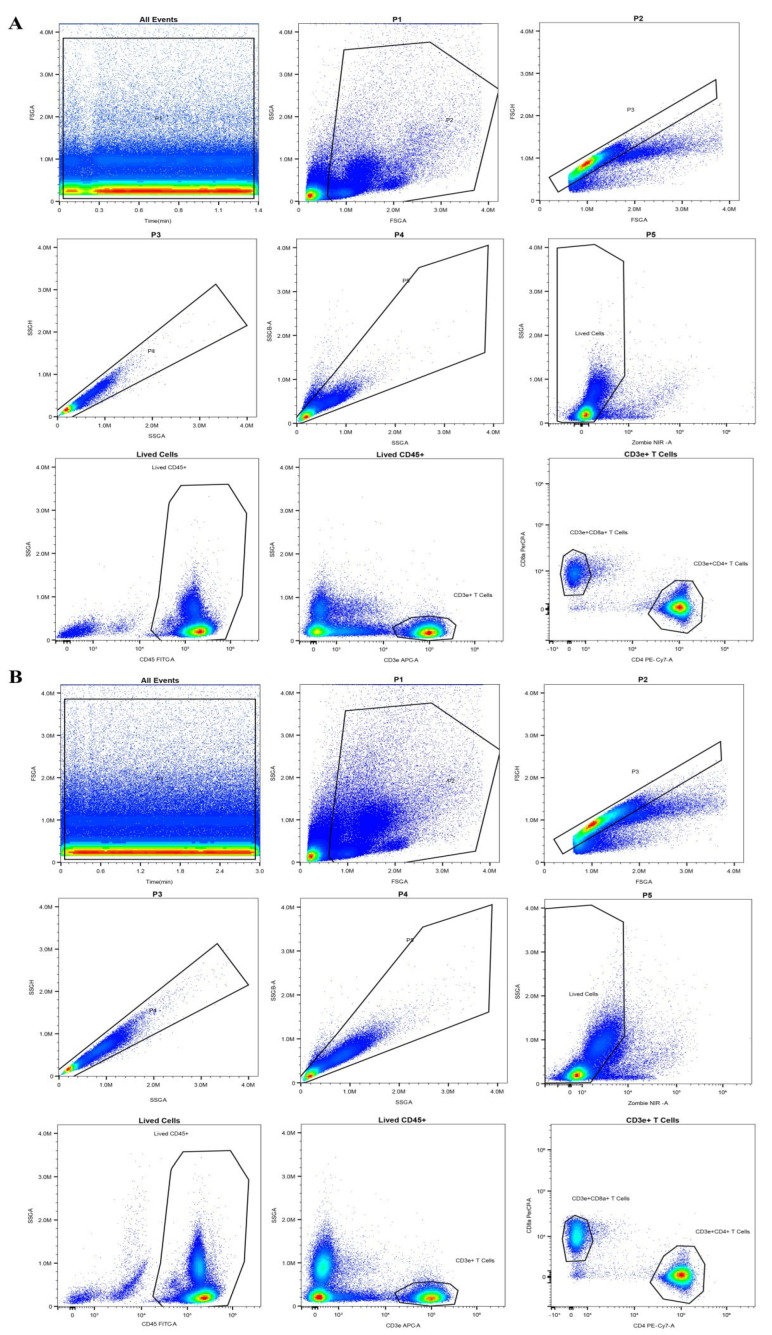
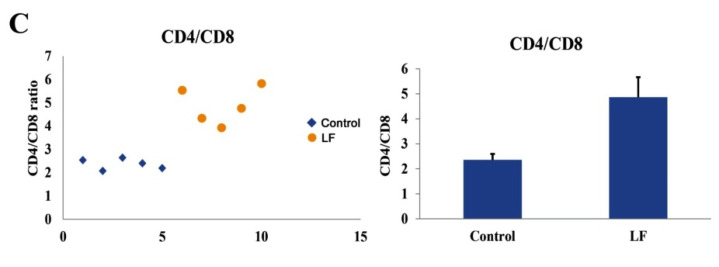
Figure 4.
Effects of Apo-LF on immunocytes in blood of mice. (A) Representative flow cytometry analysis plot for blood CD4+ and CD8+ T cells in the mice from the control group; (B) Representative flow cytometry analysis plot for blood CD4+ and CD8+ T cells in the mice treated with lactoferrin (250 mg·kg−1 b.w.); (C) The difference in the ratio of blood CD4+/CD8+ T cells between the mice treated with saline and Apo-LF. n = 5 mice per group.


