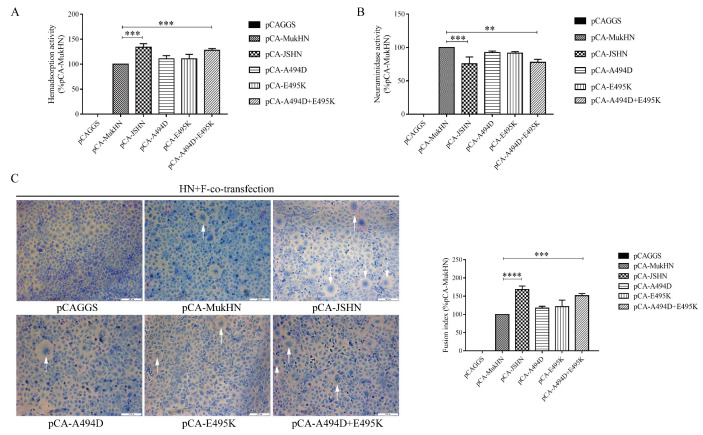
Figure 2.
Biological activities of HN proteins at the protein level. HAd (A) and NA (B) activities were determined after transfection with each HN protein expression plasmid. (C) The fusion promotion activity of different HN proteins was measured following co-transfection with each HN protein expression plasmid and the F protein plasmid. Images were taken under a microscope at ×200 magnification. The syncytia formation is indicated by white arrows. Bar indicates 200 µm. All values are normalized to the expression of the values for pCA-MukHN, which was set at 100%. ** p < 0.01, *** p < 0.001, and **** p < 0.0001.

