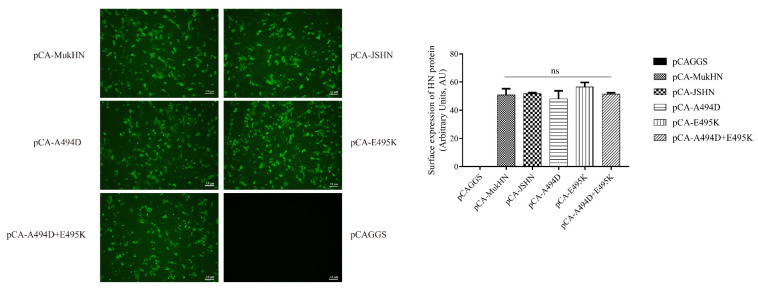
Figure 3.
Analysis of expression efficiency of different HN proteins. Different HN protein expression plasmids were transfected into Vero cells, followed by incubating with the HN protein primary antibody and corresponding secondary antibody. Images were then taken by a fluorescent microscope at ×100 magnification. Bar indicates 100 µm. IFA results were evaluated by the ImageJ software. ns indicates no significance.

