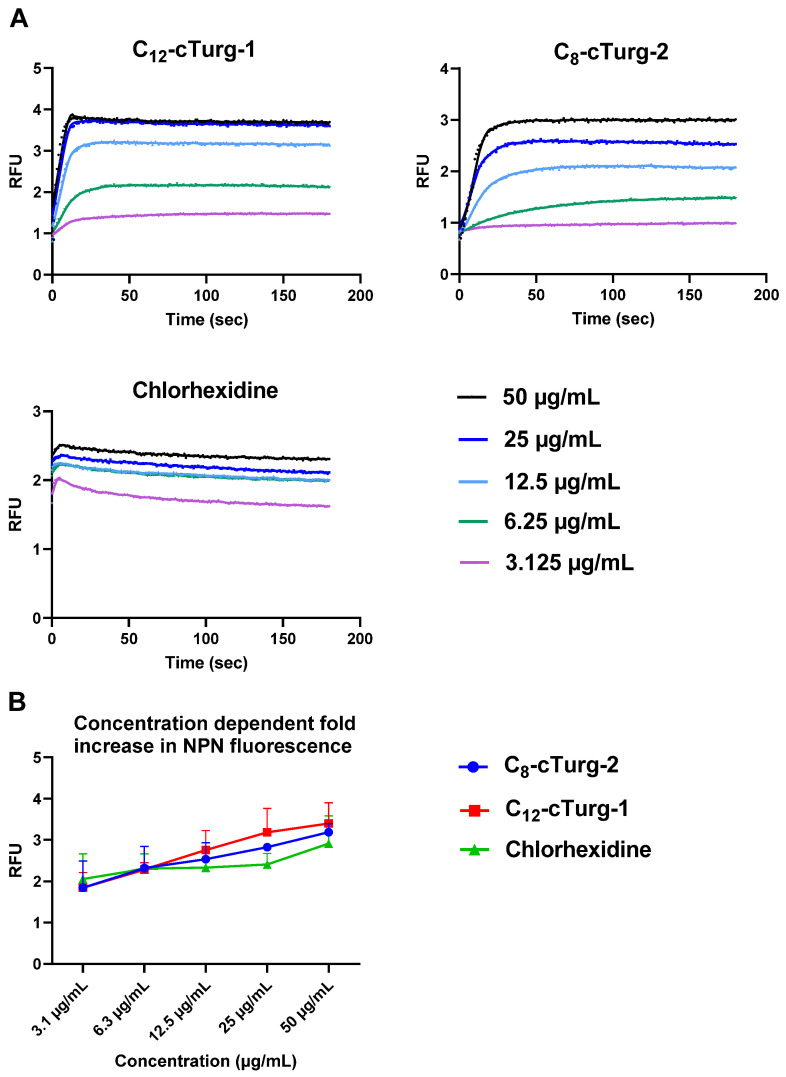
Figure 5.
(A) Comparison of the effects of C12-cTurg-1, C8-cTurg-2 and chlorhexidine on the kinetics of NPN fluorescence in E. coli MC4100 (WT). After addition of the bacterial inoculum (mixed with 20 µM NPN) to the wells (preloaded with lipopeptides), light emission was measured each second for 3 min. Each colored line represents the total 180 s data points from the assay at different concentrations. Each figure shows a representative data set. (B) E. coli MC4100 grown in MH media were treated with different concentrations of C12-cTurg-1, C8-cTurg-2 and chlorhexidine. The permeability of the outer membrane was assessed by measuring the fluorescence of NPN after 3 min (mean of three independent measurements). In all data sets, fluorescence values were compared to bacterial cells treated with the same amount of Mill-Q water control.

