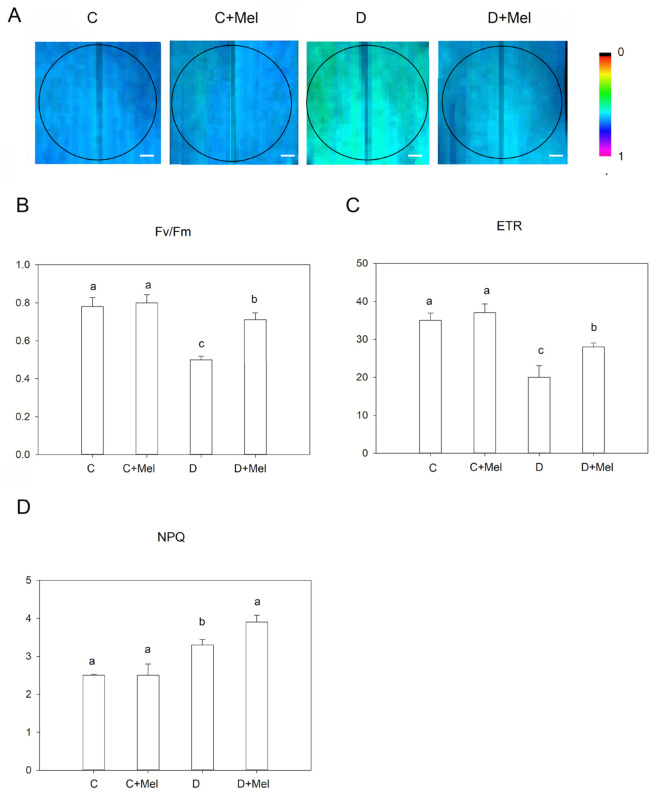
Figure 4.
Chlorophyll fluorescence parameters in tomato plants after 10 days of drought stress. Fluorescence images of maximum PSII yield (Fv/Fm) (A), maximum PSII yield (Fv/Fm) values (B), electron transport rate (ETR) (C), and non-photochemical quenching (NPQ) (D). Scale bars represent 100 µm in the fluorescence images of maximum PSII yield. The values presented above are the average of six replicates ± S.D. (n = 6). Significant differences among different treatments in the experiment were determined by LSD 0.05 test and are indicated by different letters.

