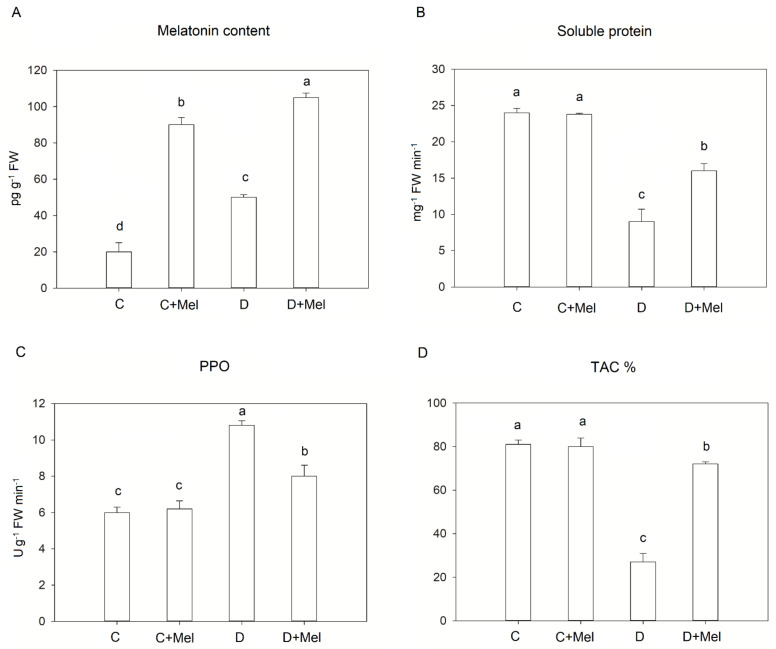
Figure 7.
Changes in melatonin content (A), soluble proteins (B), PPO (C), and antioxidant capacity (D) in tomato leaves after melatonin treatment under 10 days of drought stress. The values presented above are the average of six replicates ± S.D. (n = 6). Significant differences among different treatments in the experiment were determined by LSD 0.05 test and are indicated by different letters.

