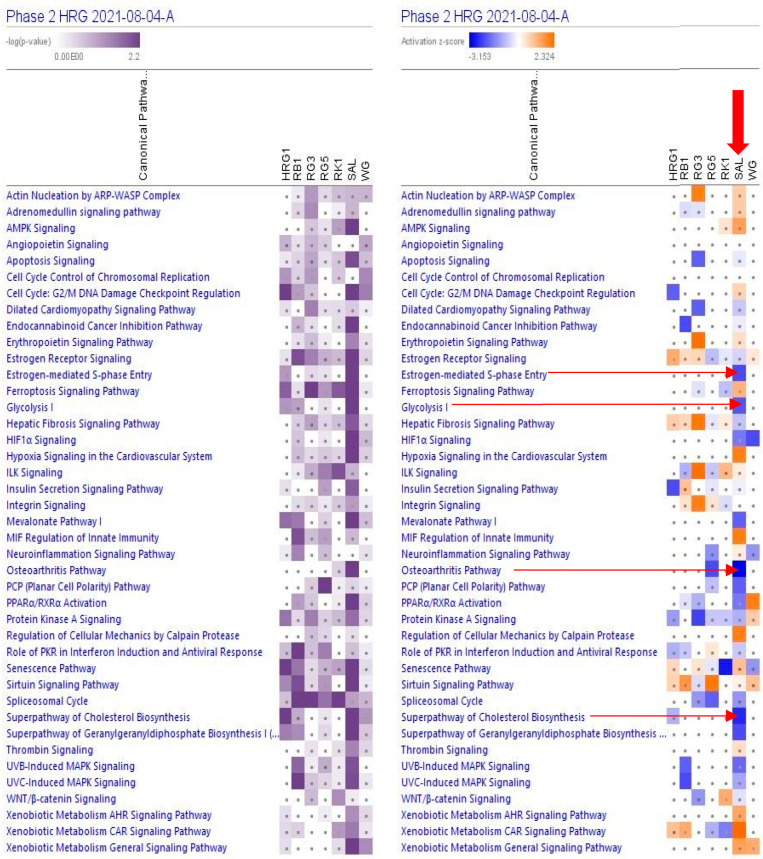
Figure 2.
Effects of RG–RS (SAL) at concentrations of 20 μg/mL, RG at concentrations of 10 μg/mL (HRG1), white ginseng (WG), and ginsenosides Rb1, Rg3, Rg5, Rk1 at the concentration of 0.1 μM on selected canonical pathways. The violet color shows the p-value (calculated using a Right-Tailed Fisher’s Exact Test), indicating the statistical significance of the overlap of analyzed dataset genes within the pathway; the intensity of color corresponds to the log p-value in a scale from 0 to 2.2 (upper panel). The brown color shows the predicted activation, and the blue color shows the predicted inhibition of signaling pathways; the intensity of the color corresponds to the activation zone on a scale from −3.153 to +2.324 (upper panel). symbol · shows that the activation z-score was < 2 and the −log p-value <1.3 = p < 0.05. An absolute z-score ≥2 is considered significant activation (+) or inhibition (-). The activation z-score predicts the activation state of the canonical pathway using the gene expression patterns of the genes within the pathway.

