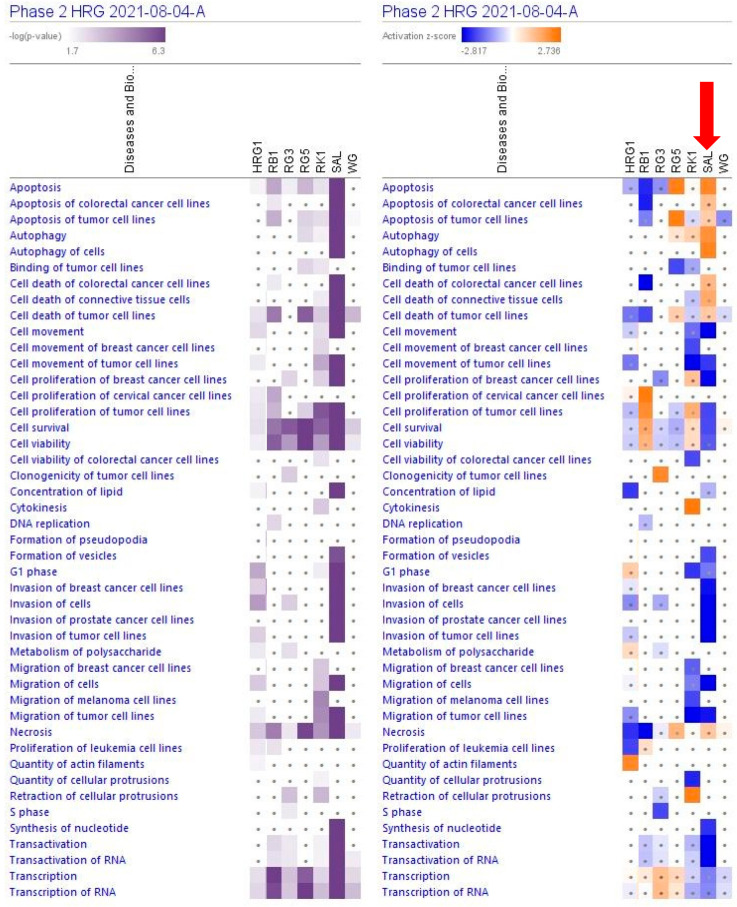
Figure 4.
Predicted effects of RG–RS (SAL) at a concentration of 20 μg/mL, RG at a concentration of 10 μg/mL (HRG1), white ginseng (WG), and ginsenosides Rb1, Rg3, Rg5, Rk1 at a concentration of 0.1 μM on cellular and physiological functions. The violet color shows the p-value (calculated using a Right-Tailed Fisher’s Exact Test), indicating the statistical significance of the overlap of analyzed dataset genes within the functions; the intensity of color corresponds to the log p-value in a scale from 1.7 to 6.3 (upper panel). The function scores are shown using a gradient from dark blue to brown for predicted activation and light to dark blue for predicted inhibition of diseases; the intensity of color corresponds to the activation zone on a scale from −2.817 to +2.736 (upper panel). symbol · shows that the activation z-score was < 2 and the −log p-value <1.3 = p < 0.05. An absolute z-score ≥2 is considered significant activation (+) or inhibition (-). The activation z-score predicts the activation state of the function using the gene expression patterns.

