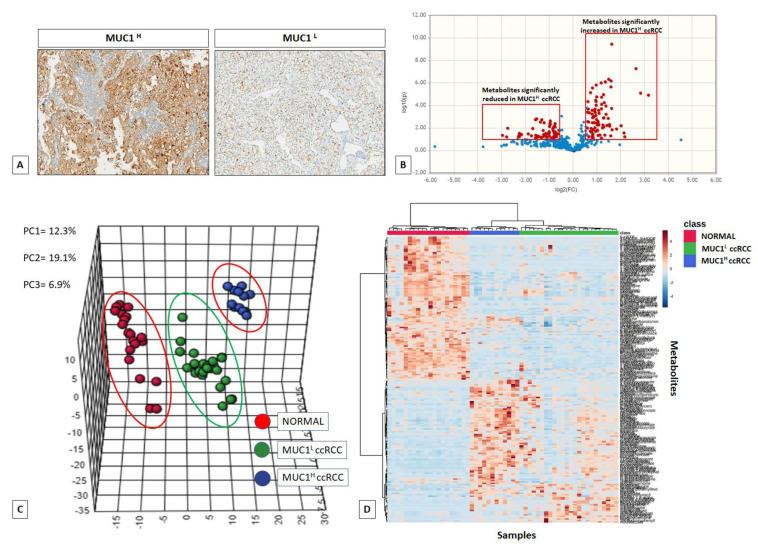
Figure 1.
MUC1 expression in ccRCC specimens (A). Volcano plot of the 516 metabolites profiled; 116 exhibited significant differential abundance when comparing MUC1H versus MUC1L ccRCC (FC cut-off = 1.5 and p < 0.05) (B). Principal component analysis (PCA) of global tissue metabolome demonstrated that the three groups (MUC1H tumors vs. MUC1L tumors vs. normal renal tissues) were clearly distinguishable (C). Hierarchical clustering heatmap analysis of metabolites in normal, MUC1H and MUC1L cancer tissues (D).

