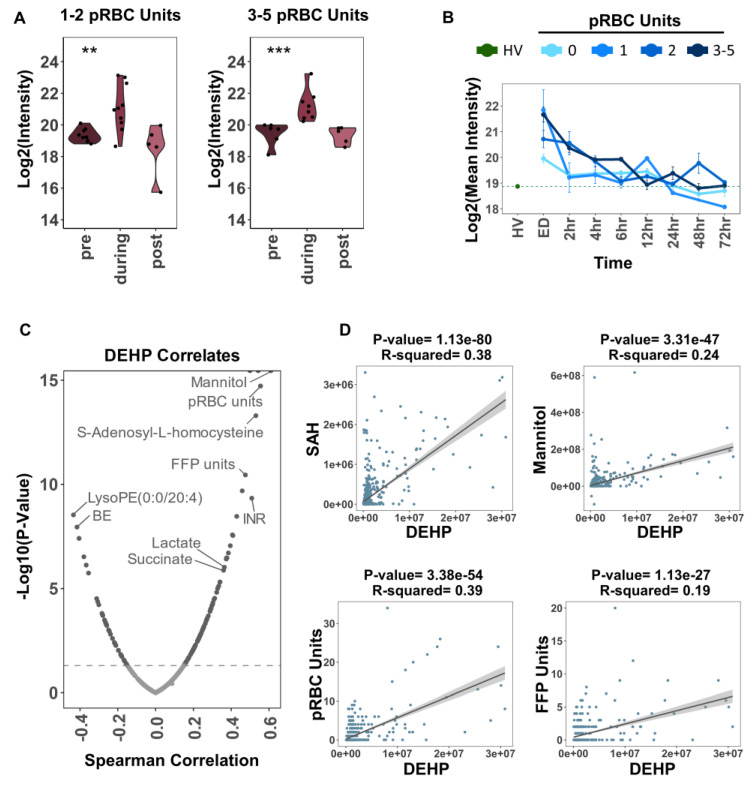
Figure 5.
Impact of pRBC transfusion on circulating levels of common plasticizers that leach from the blood bag during storage of erythrocyte concentrates. In (A), Log2 transformed DEHP intensities pre, during, and post transfusion. For patients that received 1–2 or 3–5 pRBC units during transfusion. Significance between phases were measured by ANOVA. *** p < 0.001, ** p < 0.01. In (B), Log2 transformed mean DEHP intensity for healthy volunteers compared to trauma patient temporal trends separated by the number of pRBC units received during transfusion. Error bars represent the standard error at each time point. In (C), DEHP for trauma patient time point samples from ED and 2 h were correlated (Spearman method) with all metabolites and selected clinical labs: base excess (BE), INR, FFP units, pRBC units. In (D), selected significant positive correlates (as determined in panel (C)) were fit by a simple linear model. The 95% CI of the slope is shaded in grey surrounding the regression line. The p-value and R squared of the slope are reported above each plot.

