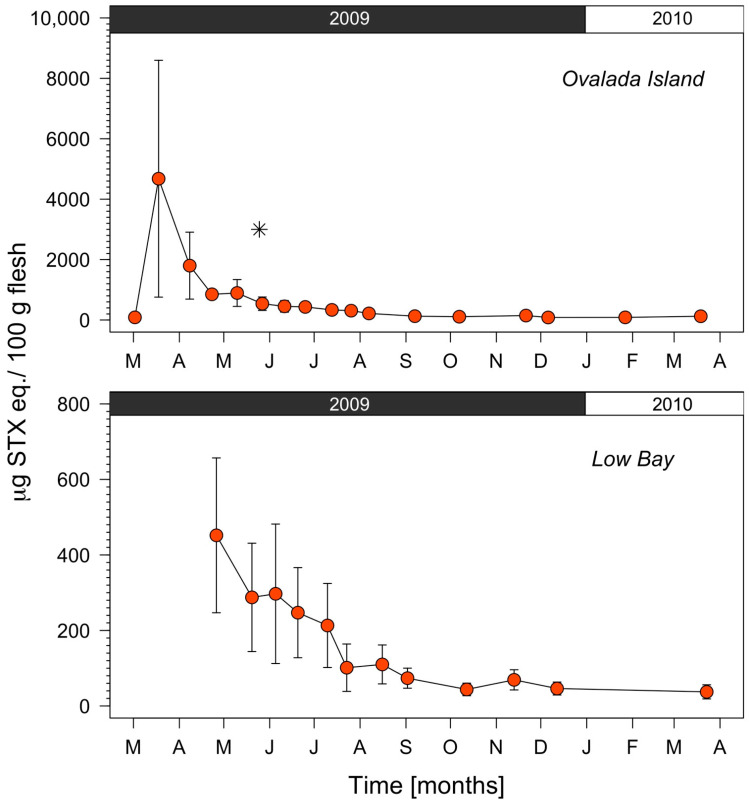
Figure 5.
Spatial and temporal distributions of PSP toxicity concentrations (μg STX eq. 100 g−1) in the clam Ameghinomya antiqua as measured at: (Upper panel) Ovalada Island and (Lower panel) Low Bay from March 2009 to March 2010. Note the differences in the y-axis limits. The asterisk (*) in the upper panel indicates the sample that was analyzed by HPLC, all other samples were analyzed by AOAC official method 959.08. Error bars represent the standard deviation from 6 (upper panel) and 12 (lower panel) clam samples.

