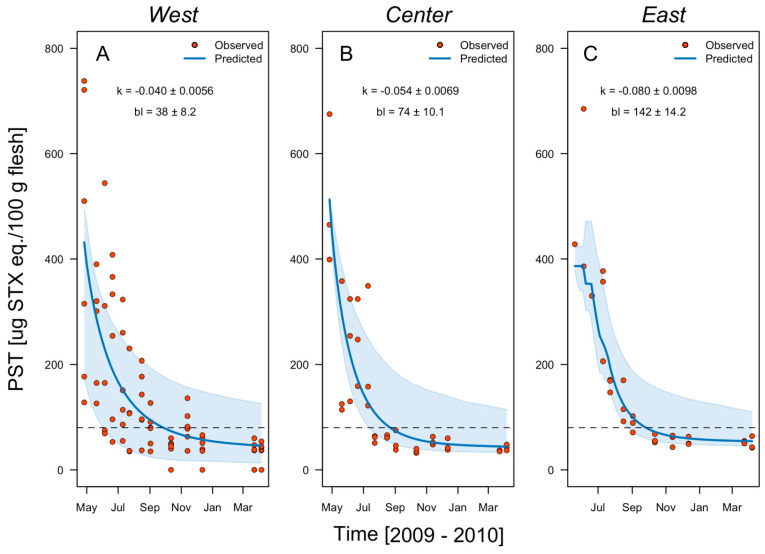
Figure 7.
Observed PST field detoxification rates (red circles) and the rates predicted in a one-box model (blue lines) for the clam Ameghinomya antiqua from March 2009 to March 2010 in three patches of the fishing zone Low Bay: west, center, and east. The instantaneous decay rate (model parameter k) is indicated in all cases. Sky-blue shaded areas indicate the confidence interval (95%) of the model estimation, and the dashed lines the regulatory limit for PST consumption by humans (80 μg STX eq. 100 g−1).

