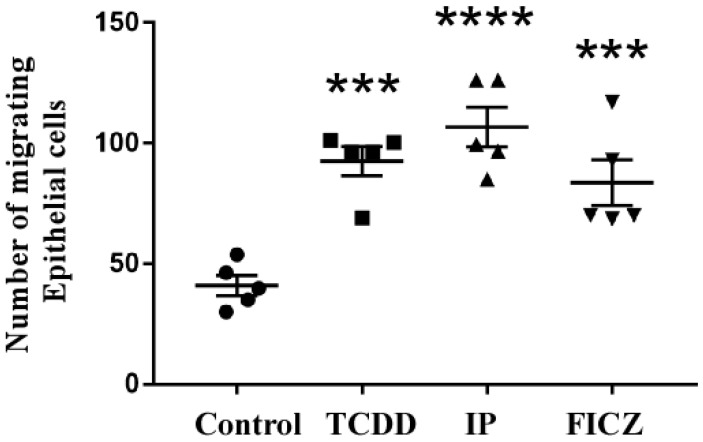
Figure 4.
Migration of epithelial cells. In serum-free DMEM/F12 medium that contained TCDD (10−8 M), IP (10−7 M), FICZ (10−7 M), MLE-12 cells were cultured for 24 h. Images were taken after 24 h. Crystal violet-stained cells took on a purple hue. The quantification of cells was performed as described above. The number of migrating cells was totaled and presented as folds of increase compared to control cells. Five independent experimental means ± SEM are represented in the graph. Unstimulated comparisons to control cultures were depicted by asterisks, such as *** p < 0.001 and **** p < 0.0001 by one-way ANOVA analysis.

