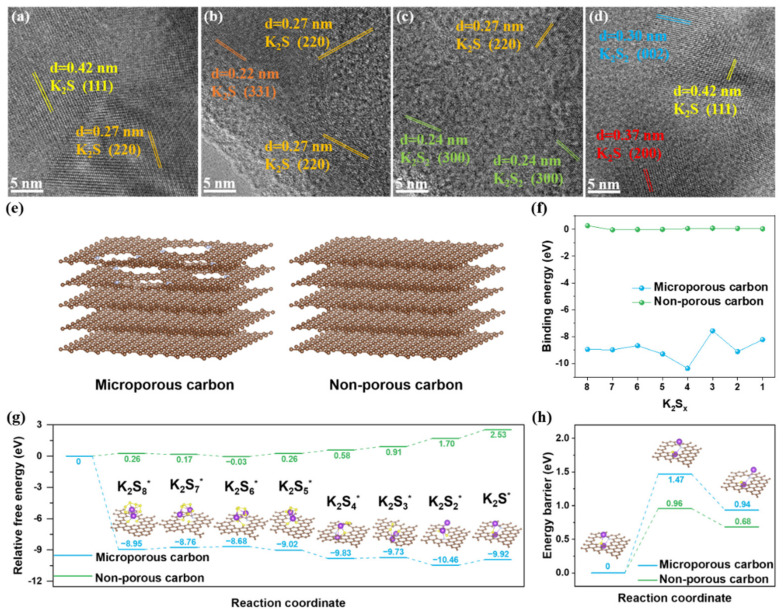
Figure 5.
HRTEM images of (a,b) S@P-NCF and (c,d) S@NCF discharged to 0.5 V versus K+/K. (e) Schematic illustration of microporous carbon model and non-porous carbon models. (f) Comparison of the binding energies of various K2Sx molecules bound to microporous and non-porous carbon models, respectively. (g) Energy profiles for the reduction in KPSs on microporous and non-porous carbon models; the insets are the corresponding adsorption configurations of KPSs on microporous carbon model. (h) The decomposition energy profiles of K2S on microporous and non-porous carbon models; the insets are decomposition path of K2S on microporous carbon model.

