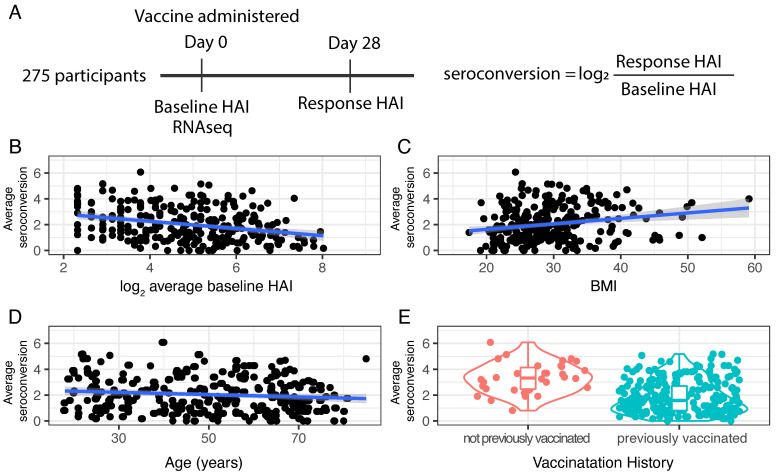
Figure 1.
Study design and response to vaccination. (A) 275 participants from the UGA4 vaccination study were selected for whole blood gene expression analysis. HAI for four strains was determined prior to vaccination (baseline HAI) and 28 days (response HAI) after vaccination and used to compute an average seroconversion score. (B) There is a significant negative relationship between average baseline HAI and average seroconversion (ρ = −0.34, p-value = 1.12 × 10⁻⁸). (C) There is a significant positive relationship between BMI and average seroconversion (ρ = 0.21, p-value = 0.0005). (D) There is a slight negative relationship between age and average seroconversion (ρ = −0.13, p-value = 0.02). (E) Those individuals who were not previously vaccinated have higher average seroconversion scores than previously vaccinated individuals.

