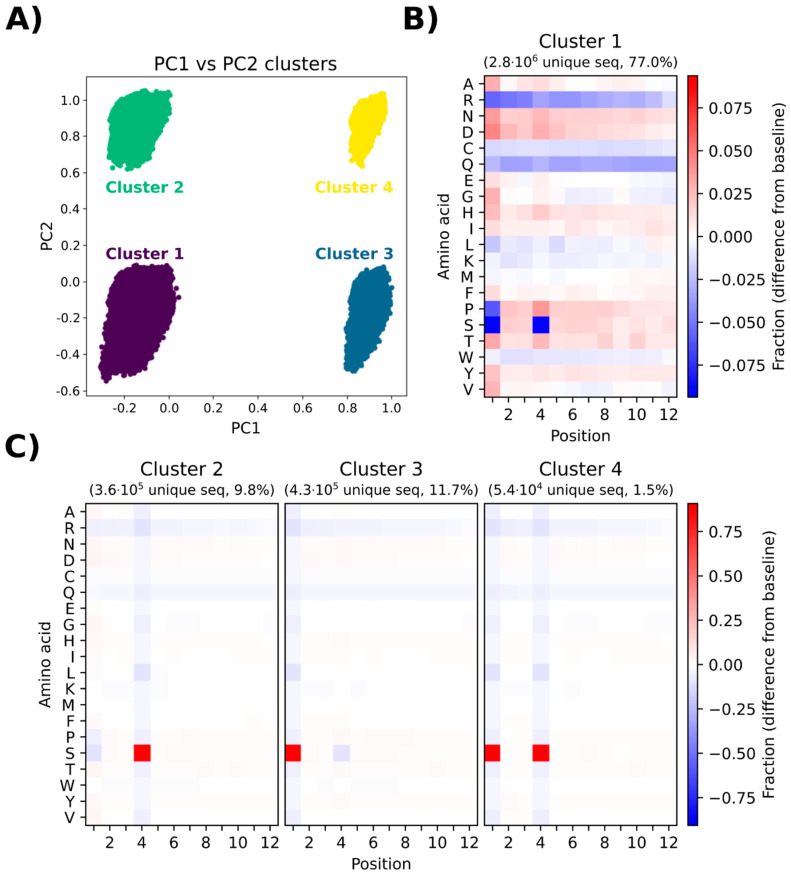
Figure 5.
(A) PCA plot (PC1 and PC2) of the naïve library showing four clusters in the pool of sequences. (B) Heatmap showing overrepresentation (red) or underrepresentation (blue) compared to the expected value of each amino acid for each position according to the expected value for cluster 1. (C) Heatmap showing overrepresentation (red) or underrepresentation (blue) compared to the expected value of each amino acid for each position according to the expected value for cluster 2, cluster 3, and cluster 4.

