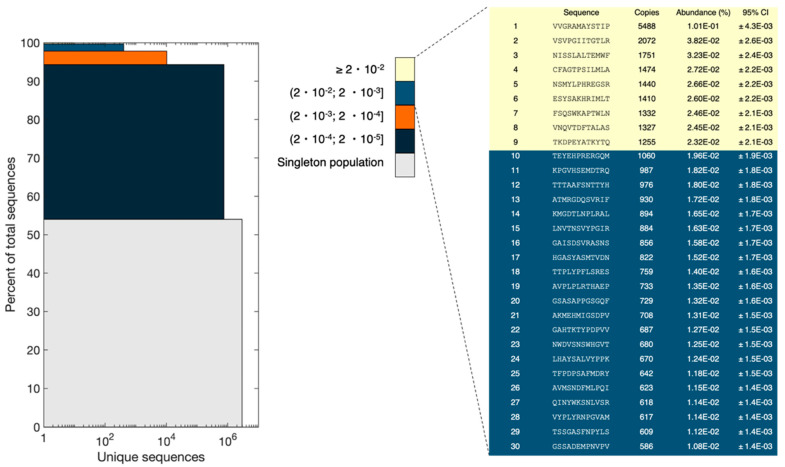
Figure 6.
Stacked bar plot with color-coded segments grouping sequences according to their abundance (see color key). The height of each segment illustrates the sum of abundance for each segment and the width corresponds to the number of unique sequences in each segment. Grey: 2,927,839 reads, 54%; dark blue: 752,541 reads, 40.3%; orange: 10,258 reads, 3.5%; light blue: 406 reads, 1.9%; yellow: 9 reads, 0.3%. The top 30 peptides are shown on the right and colored according to the bin they are included in. The 95% confidence intervals with Bonferroni correction are shown to evaluate the validity of the ranking.

