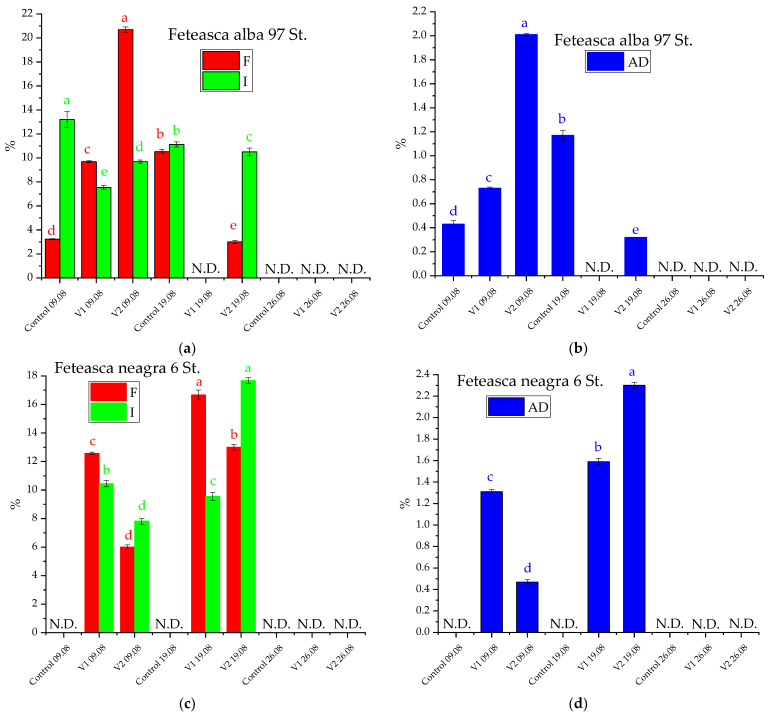
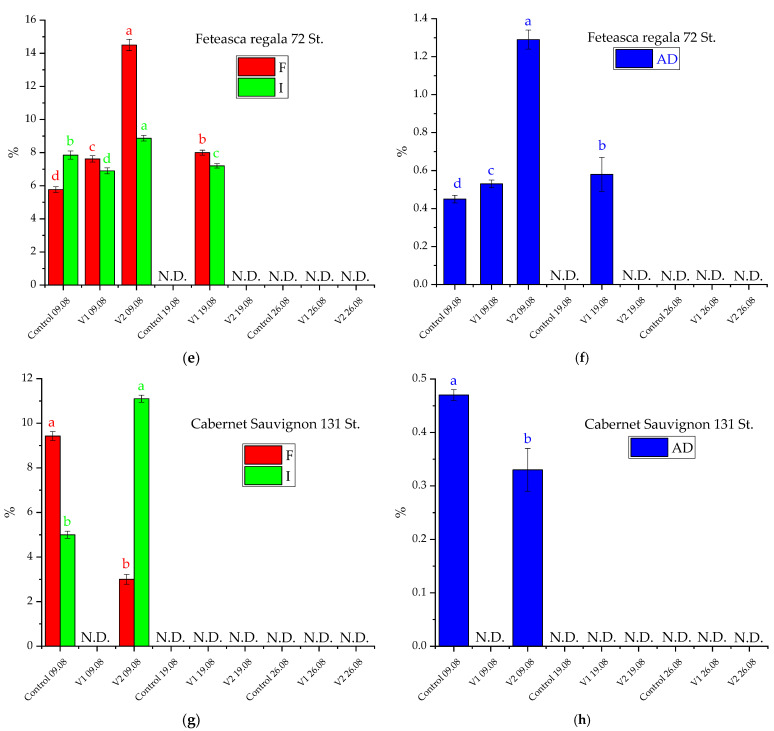
Figure 4.
Frequency (F), intensity (I), and attack degree (AD) evolution of U. necator during successive treatments in 2019 on the studied clones: (a,b): Feteasca alba 97 St; (c,d): Feteasca neagra 6 St; (e,f): Feteasca regala 72 St.; (g,h): Cabernet sauvignon 131 St.. The values represent means ± SD. Means of the same parameter (same color) without a common lowercase letter (a to e) differ (p < 0.05) as analyzed by one-way ANOVA and the TUKEY test; V1 = alcoholic extract of D. filix-mas, V2 = alcoholic extract of D. filix-mas with silver nanoparticles, C—control (chemical pesticide); N.D.—not detected (no pathogen attack registered).


