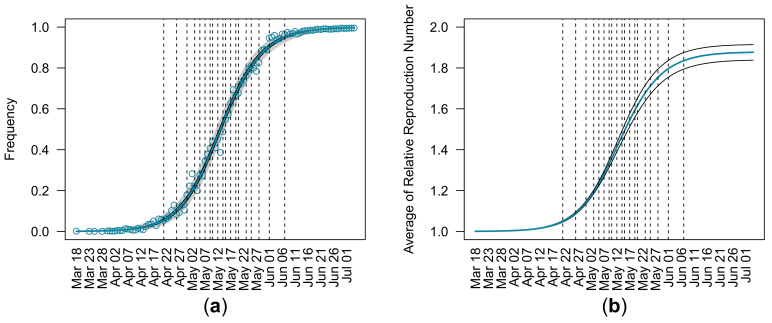
Figure 1.
Estimated relative frequencies of the Delta variant and average relative reproduction number of circulating viruses with respect to Alpha using entire observations in England from 18 March to 4 July 2021. (a) The observed and estimated relative frequencies of Delta during the Alpha–Delta replacement. Circles represent relative frequencies of Delta sequences collected in England. The blue curve represents the maximum likelihood estimates of relative frequencies of Delta. Black curves surrounding the blue curve represent 95% confidence intervals of the estimated relative frequencies of Delta. Gray area represents the 95% equal-tailed interval of beta distribution for the maximum likelihood estimations of parameters of the estimated beta-binomial distribution. (b) The maximum likelihood estimates and 95% confidence intervals of the average relative reproduction number of circulating viruses with respect to Alpha. The blue curve and black curves represent the maximum likelihood estimates and 95% confidence intervals of the average relative reproduction number of circulating viruses with respect to Alpha. Vertical dashed lines in both panels indicate the dates when the estimated relative frequency of Delta reached 0.05, 0.10, 0.15, 0.20, 0.25, 0.30, 0.35, 0.40, 0.45, 0.50, 0.55, 0.60, 0.65, 0.70, 0.75, 0.80, 0.85, 0.90, and 0.95.

